BASF Group Business Review 2nd Quarter 2016
The considerable decline in sales in the second quarter of 2016 was primarily attributable to the lack of contributions from the natural gas trading and storage business as of the end of September 2015, in addition to an oil-price-related drop in prices.1 We were able to raise sales volumes. Income from operations (EBIT) before special items2 fell considerably. Significantly higher earnings in the chemicals business3 could not compensate for substantially smaller contributions from the Oil & Gas segment, from Other, and from the Agricultural Solutions segment.
Sales and income from operations (EBIT) before special items
- Sales decline by 24% to €14.5 billion
- EBIT before special items down by 16% to €1.7 billion
Our sales decreased by 24% to €14.5 billion compared with the second quarter of 2015, mainly due to the divestiture of the gas trading and storage business as part of the asset swap with Gazprom at the end of September 2015. This business had contributed €3.0 billion to sales in the second quarter of 2015. In addition, lower raw material prices led to a drop in sales prices.
EBIT before special items declined by €336 million to €1.7 billion, primarily owing to the significantly smaller contributions from the Oil & Gas segment. Earnings likewise fell considerably in Other, as well as in the Chemicals and Agricultural Solutions segments, whereas Performance Products and Functional Materials & Solutions observed considerable increases.
1 With reference to sales, “slight” represents a change of 1–5%, while “considerable” applies to changes of 6% and higher. “At prior-year level” indicates no change (+/–0%). For earnings, “slight” means a change of 1–10%, while “considerable” is used for changes of 11% and higher. “At prior-year level” indicates no change (+/–0 %).
2 For more information on this KPI, see Alternative Performance Measures.
3 Our chemicals business comprises the Chemicals, Performance Products and Functional Materials & Solutions segments.
Factors influencing sales
|
|
2nd Quarter |
|---|---|---|
Volumes |
|
2 |
Prices |
|
(7) |
Portfolio |
|
(16) |
Currencies |
|
(3) |
|
|
(24) |
Except for Agricultural Solutions, all segments contributed to a slight increase in sales volumes. Lower raw material prices, especially in the Chemicals segment, significantly reduced sales prices. Portfolio measures largely comprised the divestiture of the natural gas trading and storage business. All divisions experienced negative currency effects.
Sales and income from operations (EBIT) before special items in the segments
Sales in the Chemicals segment were considerably down compared with the second quarter of 2015. This was mainly due to the lower price levels in all divisions brought about by a drop in raw material costs. We were able to increase sales volumes in all divisions, especially Intermediates. EBIT before special items declined considerably on account of margins. We held fixed costs to the level of the prior second quarter.
Second-quarter sales (million €, relative change)
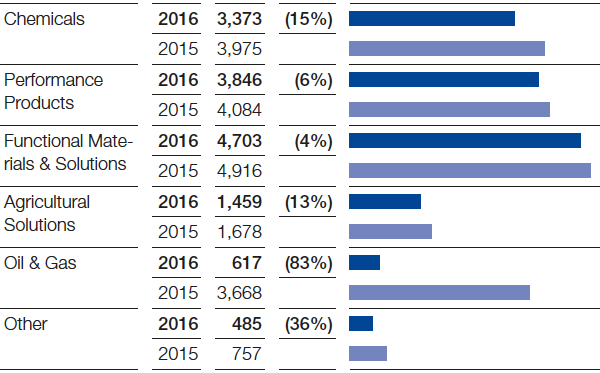
In the Performance Products segment, sales declined considerably year-on-year. Prices fell, particularly as a result of the oil-price-related reduction in raw material costs, as well as ongoing pressure on prices in the hygiene business. Several divestitures in 2015 and negative currency effects also contributed to the lower level of sales. We achieved volumes growth. Due to reduced fixed costs, improved margins in all divisions, and higher volumes, we were able to considerably boost EBIT before special items.
Compared with the second quarter of 2015, sales were slightly down in the Functional Materials & Solutions segment. This was largely the result of declining sales prices, primarily caused by the decrease in precious metal prices. Negative currency effects dampened sales in all divisions. We raised volumes, thanks especially to continuing high demand from the automotive and construction industries. EBIT before special items improved considerably in all divisions, especially the Performance Materials division.
In a market environment that remains difficult, especially in South America, we posted a considerable year-on-year sales decline in the Agricultural Solutions segment. Lower volumes and negative currency effects were the key factors for this development. We were able to slightly raise prices. EBIT before special items fell considerably, owing primarily to lower sales volumes.
Second-quarter EBIT before special items (million €, absolute change)
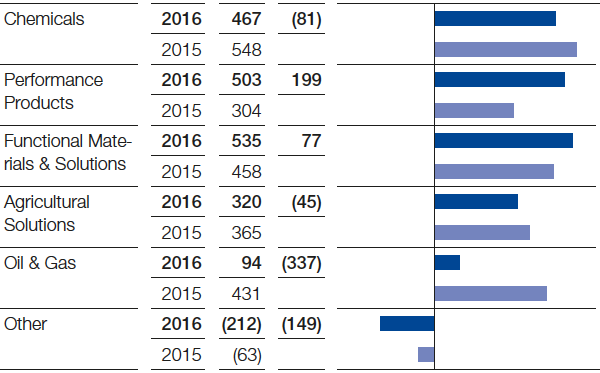
Sales in the Oil & Gas segment were considerably down in comparison with the second quarter of 2015, which had included €3.0 billion in sales from activities discontinued after the asset swap with Gazprom. Sales were additionally constrained by lower oil and gas prices. We were able to ramp up our production overall, especially in Norway. EBIT before special items fell considerably, predominantly on account of lower prices as well as the discontinued contributions from the gas trading and storage business.
In Other, sales were considerably below the level of the previous second quarter. Lower prices and volumes in the raw materials trading business were largely responsible. EBIT before special items declined considerably, particularly as a result of valuation effects for the long-term incentive program.
Income from operations (EBIT) and special items
Special items in EBIT amounted to €11 million in the second quarter of 2016, compared with minus €4 million in the same quarter of 2015. Disposal gains were partially offset by expenses for restructuring measures and special charges.
Compared with the previous second quarter, EBIT declined by €321 million to €1,718 million. EBITDA1 was down by €204 million to €2,790 million.
1 For more information on this KPI, see Alternative Performance Measures.
|
|
2016 |
2015 |
|---|---|---|---|
1st quarter |
|
(40) |
(75) |
2nd quarter |
|
11 |
(4) |
1st half |
|
(29) |
(79) |
3rd quarter |
|
|
286 |
4th quarter |
|
|
(698) |
Full year |
|
|
(491) |
Financial result and net income
At minus €177 million, the financial result was below the level of the second quarter of 2015 (minus €152 million). Especially contributing to this development was the lower level of net income from shareholdings.
Income before taxes and minority interests fell by €346 million to €1,541 million. At 26.9%, the tax rate was comparable with the previous second quarter.
Net income declined by €173 million to €1,092 million.
Earnings per share were €1.19 in the second quarter of 2016, compared with €1.38 in the same period of 2015. Adjusted for special items and amortization of intangible assets, earnings per share amounted to €1.30 (second quarter of 2015: €1.49).1
1 For more information on this KPI, see Alternative Performance Measures.
|
|
2016 |
2015 |
|---|---|---|---|
1st quarter |
|
1.64 |
1.43 |
2nd quarter |
|
1.30 |
1.49 |
1st half |
|
2.94 |
2.92 |
3rd quarter |
|
|
1.07 |
4th quarter |
|
|
1.01 |
Full year |
|
|
5.00 |