Results of Operations
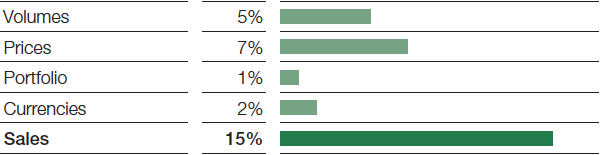
Compared with the first half of 2016, BASF Group sales grew by €4,430 million to €33,121 million. This development was largely driven by significantly higher sales prices, especially in the Chemicals segment, as well as by volumes increases in all segments. Sales were also supported by currency effects and by the Chemetall business acquired from Albemarle in December 2016.
Factors influencing BASF Group sales, 1st Half 2017
We raised income from operations (EBIT) before special items1 by €1,095 million to €4,708 million, primarily as a result of the substantially improved contribution from the Chemicals segment. EBIT before special items also rose considerably in the Oil & Gas segment. In the Functional Materials & Solutions segment, EBIT before special items decreased slightly, while the Performance Products and Agricultural Solutions segments saw considerable declines. Earnings in the chemicals business2 contained insurance payments of €200 million for the accident at the North Harbor of the Ludwigshafen site in October 2016, an amount which predominantly pertained to the Chemicals segment.
Special items in EBIT amounted to minus €76 million in the first half of 2017. These largely comprised expenses for restructuring measures and integration costs; also included were expenses from divestitures as well as other special income. In the same period of 2016, special items had amounted to minus €29 million, mainly containing expenses for restructuring measures that counterbalanced gains on disposals.
EBIT3 grew by €1,048 million to €4,632 million compared with the first half of 2016.
Year-on-year, income from operations before depreciation, amortization and special items (EBITDA before special items)4 increased by €1,281 million to €6,798 million and EBITDA4 by €1,133 million to €6,735 million.
1 For an explanation of this figure, see the BASF Report 2016, Value-based management.
2 Our chemicals business comprises the Chemicals, Performance Products and Functional Materials & Solutions segments.
3 The calculation of income from operations (EBIT) is shown in the Statement of Income.
4 For an explanation of this figure, see the BASF Report 2016, Additional figures for results of operations.
|
|
2017 |
2016 |
|---|---|---|---|
EBIT |
|
4,632 |
3,584 |
– Special items |
|
(76) |
(29) |
EBIT before special items |
|
4,708 |
3,613 |
+ Depreciation, amortization and valuation allowances on property, plant and equipment and intangible assets before special items |
|
2,090 |
1,904 |
EBITDA before special items |
|
6,798 |
5,517 |
|
|
2017 |
2016 |
|---|---|---|---|
EBIT |
|
4,632 |
3,584 |
+ Depreciation, amortization and valuation allowances on property, plant and equipment and intangible assets |
|
2,103 |
2,018 |
EBITDA |
|
6,735 |
5,602 |
At minus €326 million, the financial result improved by €39 million. This was predominantly the result of lower interest expenses due to more favorable refinancing conditions as well as higher interest income from combined interest and cross-currency swaps.
Income before taxes and minority interests was up by €1,087 million to €4,306 million. The tax rate grew from 20.9% to 22.5%, mainly due to the greater proportion of more highly taxed earnings contributions. Minority interests rose by €63 million to €131 million.
Net income increased by €726 million to €3,205 million.
Earnings per share were €3.49 in the first half of 2017, compared with €2.70 in the same period of the previous year. Earnings per share adjusted5 for special items as well as amortization of and valuation allowances on intangible assets amounted to €3.75 (first half of 2016: €2.94).
5 For an explanation of this figure, see the BASF Report 2016, Additional figures for results of operations
|
|
|
2017 |
2016 |
|---|---|---|---|---|
Income before taxes and minority interests |
|
|
4,306 |
3,219 |
– Special items |
|
|
(76) |
(29) |
+ Amortization and valuation allowances on intangible assets |
|
|
283 |
299 |
– Amortization and valuation allowances on intangible assets contained in special items |
|
|
− |
42 |
Adjusted income before taxes and minority interests |
|
|
4,665 |
3,505 |
– Adjusted income taxes |
|
|
1,090 |
741 |
Adjusted income before minority interests |
|
|
3,575 |
2,764 |
– Adjusted minority interests |
|
|
132 |
68 |
Adjusted net income |
|
|
3,443 |
2,696 |
Weighted average number of outstanding shares |
|
in thousands |
918,479 |
918,479 |
Adjusted earnings per share |
|
€ |
3.75 |
2.94 |
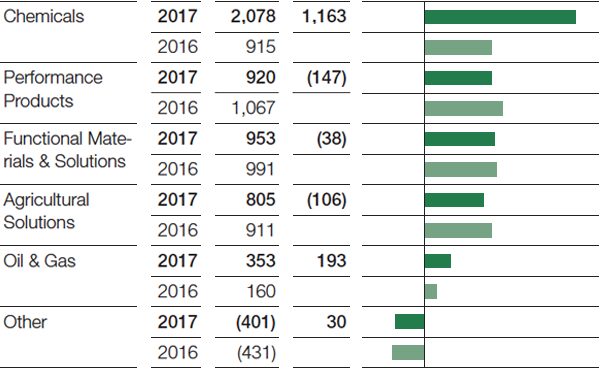
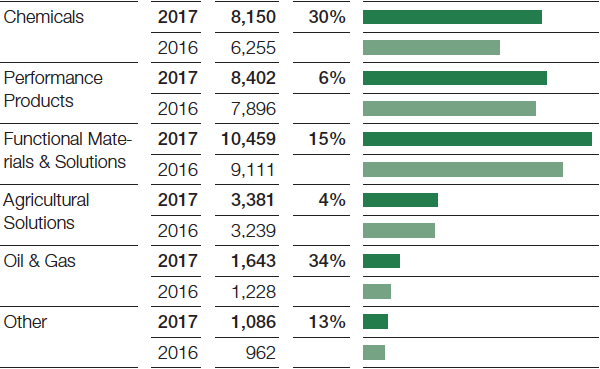
Sales and EBIT before special items in the segments
We achieved strong sales growth in the Chemicals segment compared with the first half of 2016. Significantly higher prices in response to rising raw material prices and high demand on the market were largely responsible for the increase. Sales volumes grew slightly. Currency effects also positively influenced sales development. Higher margins and volumes were the main drivers behind a considerable increase in EBIT before special items. Insurance payments compensated for the negative impact on earnings resulting from the accident at the Ludwigshafen site’s North Harbor in October 2016. Fixed costs were slightly reduced overall.
In the Performance Products segment, sales were considerably above prior first-half levels. This was mainly the result of increased volumes in the Dispersions & Pigments, Care Chemicals and Performance Chemicals divisions. We raised sales prices, and all divisions experienced positive currency effects. Portfolio effects dampened sales development. EBIT before special items declined considerably, primarily due to the lower margins resulting from higher raw material prices.
Sales in the Functional Materials & Solutions segment grew considerably compared with the first half of the previous year. This development was largely attributable to an increase in sales volumes, the Chemetall business acquired from Albemarle in December 2016, and higher prices. Currency effects also had a positive influence on sales. Demand rose from the automotive industry. EBIT before special items was slightly below the level of the previous first half due to higher fixed costs and lower margins.
In the Agricultural Solutions segment, we were able to slightly increase sales year-on-year, mostly due to higher sales volumes and positive currency effects. Sales prices were slightly below the level of the first half of 2016. EBIT before special items fell considerably. This was mainly the result of higher fixed costs in addition to lower average margins from a different product mix.
Compared with the first half of 2016, the Oil & Gas segment saw a considerable sales increase as a result of higher volumes and prices. The growth in volumes was largely due to higher sales volumes of gas in addition to an offshore lifting in Libya in June 2017. The price of a barrel of Brent blend crude oil averaged $52 in the first half of 2017 (first half of 2016: $40). Gas prices on European spot markets also increased. The considerable rise in EBIT before special items was primarily driven by the higher levels of prices and volumes.
Sales in Other rose considerably, mainly as a result of increased prices in raw materials trading. EBIT before special items improved slightly, mostly due to valuation effects for our long-term incentive program.
First-half sales
(Million €, relative change)
First-half EBIT before special items
(Million €, absolute change)