BASF Group Business Review 1st Half 2015
Sales for the BASF Group rose slightly in the first half of 2015, favorably influenced by currency effects and by increased volumes in the Oil & Gas segment. Lower prices resulting from the sharp drop in the price of oil put a strain on sales development. Income from operations before special items matched the level of the first half of 2014, supported in particular by the substantially higher contribution from the Functional Materials & Solutions segment.
Sales and income from operations before special items
- Sales rise by 3% to €39.1 billion
- At around €4.1 billion, earnings match level of same period of 2014
Compared with the first half of 2014, our sales grew by 3% to €39.1 billion despite slightly declining sales volumes in the chemicals business1. This was largely thanks to positive currency effects in all divisions as well as higher volumes in gas trading. Lower prices for crude oil weighed down sales in the Oil & Gas segment as well as in our chemicals business.
At around €4.1 billion, income from operations before special items matched the level of the first half of the previous year. The oil price-related decline in the Oil & Gas segment dampened earnings, while the Functional Materials & Solutions and Chemicals segments provided support through greater contributions. The Agricultural Solutions segment matched the earnings of the previous first half; the Performance Products segment and Other remained below the level of the same period of 2014.
1 Our chemicals business comprises the Chemicals, Performance Products and Functional Materials & Solutions segments.
Factors influencing sales
|
Factors influencing sales in 2015 (% of sales) | ||
|---|---|---|
|
|
|
1st Half |
|
Volumes |
|
3 |
|
Prices |
|
(8) |
|
Portfolio |
|
0 |
|
Currencies |
|
8 |
|
|
|
3 |
We raised our sales volumes year-on-year, boosted by a sharp volumes increase in the Oil & Gas segment’s natural gas trading business. Sales volumes remained stable in the Functional Materials & Solutions segment, while declining slightly in the other segments. Prices decreased overall on account of the lower price of oil, especially in the Chemicals and Oil & Gas segments; they rose in the Agricultural Solutions segment, however. Currency effects were positive in all segments. The disposal of our share in the Ellba Eastern Private Ltd. joint operation in Singapore slightly reduced sales.
Sales and income from operations before special items in the segments
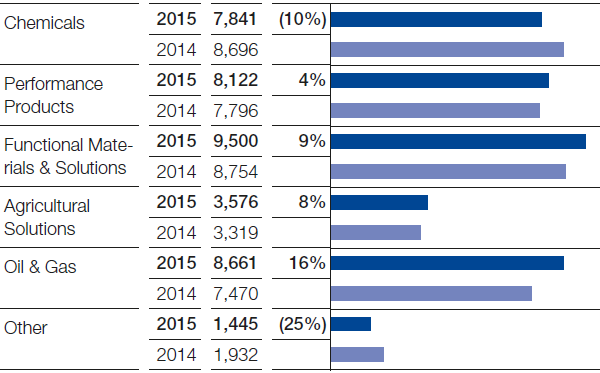
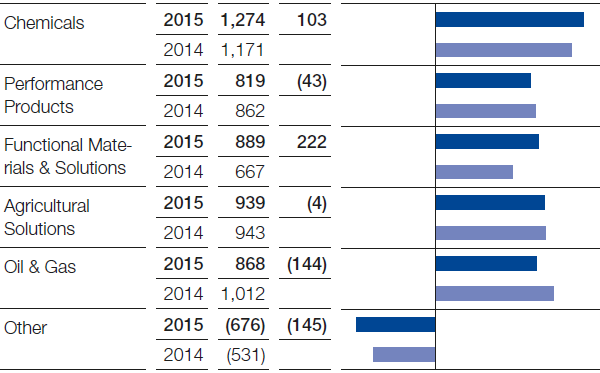
Sales in the Chemicals segment fell considerably below the level of the previous first half. This was mainly due to the price declines resulting from lower raw material costs, especially in the Petrochemicals division. Sales were additionally reduced by the disposal of our share in the Ellba Eastern Private Ltd. joint operation in Singapore at the end of 2014, as well as by slightly lower overall volumes. Currency effects had a positive impact on sales, however. Earnings grew slightly, primarily through the increased contribution from Petrochemicals.
First-half sales (million €, relative change)

In the Performance Products segment, sales rose slightly on account of positive currency effects that more than offset declining prices and a slight decrease in overall sales volumes. Price trends were especially dampened by the difficult market environment for paper chemicals as well as by intense competition in the vitamin E business. We posted a slight decline in earnings, largely due to an increase in fixed costs.
Compared with the same period of the previous year, we achieved considerably higher sales in the Functional Materials & Solutions segment. Positive currency effects were the main driver here. With volumes stable, prices dipped slightly overall. We were able to boost sales to the automotive industry, while volumes fell in precious metal trading. We considerably improved earnings, mainly thanks to the contribution from the Performance Materials division.
Sales in the Agricultural Solutions segment grew considerably compared with the first half of 2014, despite a slight decrease in volumes. This was predominantly the result of positive currency effects, especially from the strong U.S. dollar, as well as higher prices overall. Earnings reached the level of the previous first half. Increased fixed costs due to the startup of several plants put a strain on earnings, while prices and currency effects had a favorable impact.
First-half EBIT before special items (million €, absolute change)

We considerably raised our sales in the Oil & Gas segment. In addition to the sharp volumes increase in the Natural Gas Trading business sector, we also posted slight growth in the Exploration & Production business sector. Sales were dampened by substantially lower prices for crude oil and natural gas. Income from operations before special items fell considerably. An improved earnings contribution from Natural Gas Trading was not able to fully offset the primarily oil price-related decrease in the Exploration & Production business sector. Earnings in the same period of the previous year had been boosted by offshore lifting in Libya.
Sales in Other declined considerably. This was predominantly influenced by the lower plant availability resulting from the outage at the Ellba C.V. joint operation in Moerdijk, Netherlands, as well as the disposal of our share in the Ellba Eastern Private Ltd. joint operation in Singapore. Decreased raw material trading further reduced sales. Income from operations before special items fell considerably, due in part to the sale in 2014 of our 50% share in Styrolution Holding GmbH as well as to currency effects not allocated to the segments.
Income from operations and special items
Special items in EBIT totaled minus €79 million in the first half of 2015 (first half of 2014: €30 million). These especially contained expenses for the employee bonus on the occasion of BASF’s 150th anniversary. Furthermore, disposal gains were lower than in the same period of 2014.
EBIT decreased by €120 million to €4,034 million year-on-year. EBITDA rose by €228 million to €5,884 million as a result of higher amortization and depreciation.
|
Special items reported in earnings before taxes (million €) | |||
|---|---|---|---|
|
|
|
2015 |
2014 |
|
1st quarter |
|
(75) |
67 |
|
2nd quarter |
|
8 |
(79) |
|
1st half |
|
(67) |
(12) |
|
3rd quarter |
|
|
(29) |
|
4th quarter |
|
|
507 |
|
Full year |
|
|
466 |
Financial result and net income
At minus €316 million, the financial result slightly exceeded the level of the first half of 2014 (minus €319 million). Higher interest income led to a considerable improvement in the interest result. This was partly countered by declines in other financial result and income from shareholdings.
Income before taxes and minority interests decreased by €117 million year-on-year to €3,718 million. The tax rate was at 28.2% (first half of 2014: 25.6%).
Net income fell by €284 million to €2,439 million.
Earnings per share amounted to €2.66 in the first half of 2015 compared with €2.96 in the same period of the previous year. Adjusted for special items and amortization of intangible assets, earnings per share amounted to €2.92 (first half of 2014: €3.16).
|
Adjusted earnings per share (€) | |||
|---|---|---|---|
|
|
|
2015 |
2014 |
|
1st quarter |
|
1.43 |
1.63 |
|
2nd quarter |
|
1.49 |
1.53 |
|
1st half |
|
2.92 |
3.16 |
|
3rd quarter |
|
|
1.24 |
|
4th quarter |
|
|
1.04 |
|
Full year |
|
|
5.44 |