Agricultural Solutions
2nd Quarter 2015
- Sales improve slightly thanks to positive currency effects and higher prices
- Lower volumes combined with startup costs for new plants lead to considerable decline in earnings
Despite a challenging market environment with sharply fallen prices for agricultural products, we slightly raised our sales in the Agricultural Solutions segment compared with the previous second quarter. Positive currency effects and higher sales prices contributed greatly to this, while volumes declined (volumes –8%, prices 3%, currencies 6%).
Sales
Change compared with 2nd quarter 2014
+1%
EBIT before special items
(Change compared with 2nd quarter 2014)
Million €
365 (−68)
In Europe, sales were slightly down compared with the second quarter of 2014. Higher prices, especially in eastern Europe, were unable to fully compensate for declining sales volumes. Volumes were lower for cereal fungicides due to strong demand at the beginning of the season as well as the ongoing drought in western Europe.
Sales in North America were slightly above the prior second-quarter level on account of positive currency effects. Our customers’ above-average inventory levels and dry weather conditions in Canada and California resulted in a decrease in sales volumes of fungicides.
South America saw a slight increase in sales, particularly driven by higher prices and volumes in our fungicides business and in the Functional Crop Care business unit. This enabled us to more than offset the weaker demand for insecticides brought about by high competitive pressure from generic products.
In Asia, sales considerably surpassed the level of the previous second quarter due to positive currency effects. Sales volumes declined overall, mainly as a consequence of substantially lower demand for herbicides in India. We raised our volumes in Japan and Korea.
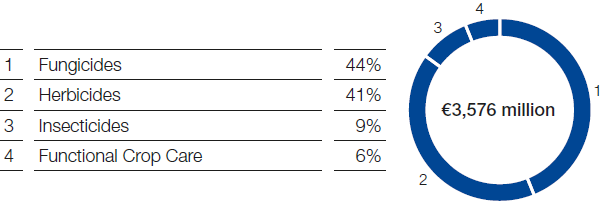
1st Half 2015 – Sales by indication and business

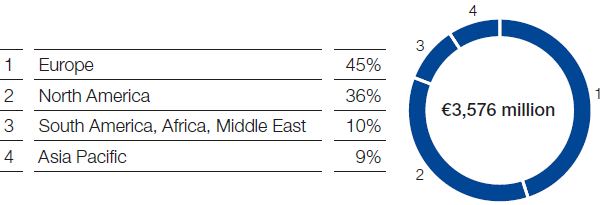
1st Half 2015 – Sales by region (location of customer)

Income from operations before special items fell considerably compared with the second quarter of 2014. This was largely because of lower sales volumes and increased fixed costs through the startup of new plants.
|
Segment data Agricultural Solutions (million €) | |||||||
|---|---|---|---|---|---|---|---|
|
|
|
2nd Quarter |
1st Half | ||||
|
|
|
2015 |
2014 |
Change in % |
2015 |
2014 |
Change in % |
|
Sales to third parties |
|
1,678 |
1,666 |
1 |
3,576 |
3,319 |
8 |
|
Income from operations before amortization and depreciation (EBITDA) |
|
422 |
476 |
(11) |
1,048 |
1,028 |
2 |
|
Income from operations (EBIT) before special items |
|
365 |
433 |
(16) |
939 |
943 |
0 |
|
Income from operations (EBIT) |
|
365 |
433 |
(16) |
938 |
943 |
(1) |
|
Assets (as of June 30) |
|
8,514 |
7,654 |
11 |
8,514 |
7,654 |
11 |
|
Research expenses |
|
132 |
131 |
1 |
258 |
243 |
6 |
|
Additions to property, plant and equipment and intangible assets |
|
106 |
105 |
1 |
191 |
168 |
14 |