BASF Group Business Review 3rd Quarter 2015
In a weaker economic environment than expected, our sales in the third quarter of 2015 were slightly below the level of the previous third quarter. The sharp drop in the price of oil led to significantly lower prices, which weighed down our sales in the chemicals business1 and in the Oil & Gas segment. Income from operations before special items declined slightly. While we achieved a slight overall increase in the chemicals business, earnings fell considerably in the Oil & Gas and Agricultural Solutions segments as well as in Other.
Sales and income from operations before special items
- Sales down by 5% to €17.4 billion
- Earnings decline by 10% to €1.6 billion
Compared with the third quarter of 2014, our sales decreased by 5% to €17.4 billion, mostly due to lower prices in connection with the price of oil. This reduced sales in the chemicals business, particularly in the Chemicals segment. The Oil & Gas segment also saw a price-related sales decrease. Positive currency effects in nearly every division helped slow this decline.
We posted a €171 million decline in income from operations before special items, which amounted to €1.6 billion. In the chemicals business, the contribution from the Chemicals segment rose slightly while that of the Functional Materials & Solutions segment increased sharply, more than compensating for the significant decrease in the Performance Products segment. Earnings were considerably down in the Oil & Gas and Agricultural Solutions segments. The contribution from Other shrank considerably as a result of the lower amount of reversed provisions for our long-term incentive (LTI) program as compared with the previous year.
Factors influencing sales
|
Factors influencing sales in 2015 (% of sales) | |||
|---|---|---|---|
|
|
|
3rd Quarter |
Jan. – Sep. |
|
Volumes |
|
(1) |
2 |
|
Prices |
|
(8) |
(8) |
|
Portfolio |
|
0 |
0 |
|
Currencies |
|
4 |
7 |
|
|
|
(5) |
1 |
Sales volumes were slightly lower than in the previous third quarter. Volumes were down in the chemicals business, but rose in the Agricultural Solutions and Oil & Gas segments. The sharp drop in the price of oil led to declining prices overall, primarily in the Chemicals and Oil & Gas segments. We observed positive currency effects in every division except Crop Protection. Sales were negatively impacted by reduced raw material trading in Other. Portfolio measures had no appreciable impact on sales development.
Sales and income from operations before special items in the segments
Sales in the Chemicals segment were considerably below the level of the previous third quarter. This was essentially due to lower prices on account of decreased raw material costs, especially in the Petrochemicals division. Sales were also reduced by the disposal of our share in the Singapore-based Ellba Eastern Private Ltd. joint operation at the end of 2014. These developments were partially countered by positive currency effects and volumes increases in the Intermediates and Monomers divisions. Earnings grew slightly, mostly as a result of higher margins in the Petrochemicals division.
Third-quarter sales (million €, relative change)
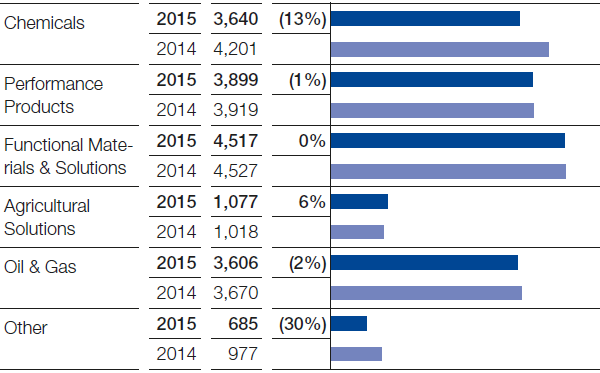
The Performance Products segment’s sales declined slightly year-on-year. This was due to lower prices, weaker volumes and the lack of sales from the textile chemicals business sold in June 2015. Currency effects had a positive influence on sales in all divisions. Decreased sales volumes were brought about by lower volumes in the pigments business as well as weak demand in the oilfield chemicals business in connection with oil price developments. Intense competition in the vitamin business put pressure on our prices. The market environment for paper chemicals remained difficult. Earnings were considerably down as a consequence of higher fixed costs, stemming particularly from the startup of new plants as well as currency effects.
In the Functional Materials & Solutions segment, sales matched the level of the third quarter of 2014. Positive currency effects counterbalanced lower prices and a slight decline in volumes. Continuing high demand from the automotive and construction industry was not able to fully offset lower sales volumes in precious metal trading. Earnings grew considerably, mainly thanks to an earnings increase in the Performance Materials division.
Compared with the previous third quarter, we were able to raise sales considerably in the Agricultural Solutions segment through higher volumes and prices. The sharp depreciation of the Brazilian real resulted in negative currency effects. Earnings fell considerably.
Third-quarter EBIT before special items (million €, absolute change)
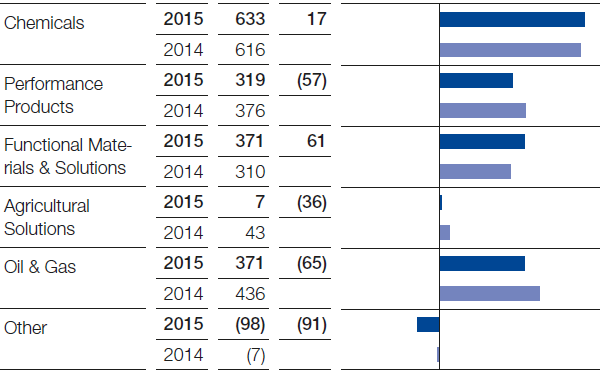
The Oil & Gas segment’s sales were slightly down year-on-year, predominantly on account of a price-related sales decline in the Natural Gas Trading business sector. Despite a sharp drop in the price of oil, sales grew in the Exploration & Production business sector thanks to higher volumes and portfolio effects. The smaller contribution from Natural Gas Trading resulted in a considerable decrease in earnings.
Sales in Other fell considerably compared with the third quarter of 2014. Decreased raw material trading and the disposal of our share in the Ellba Eastern Private Ltd. joint operation at the end of 2014 were primarily responsible for this development. Income from operations before special items declined considerably, primarily because of fewer reversals in provisions for the long-term incentive program as compared with the prior third quarter.
Income from operations and special items
Special items in EBIT totaled €286 million in the third quarter of 2015, compared with minus €32 million in the third quarter of 2014. This was particularly the result of gains from the asset swap with Gazprom concluded at the end of September 2015.
Compared with the previous third quarter, EBIT grew by €147 million to €1,889 million. EBITDA grew by €358 million to €2,872 million. This was largely the result of a €211 million increase in depreciation, particularly in connection with investment projects.
|
Special items reported in earnings before taxes (million €) | |||
|---|---|---|---|
|
|
|
2015 |
2014 |
|
1st quarter |
|
(75) |
67 |
|
2nd quarter |
|
8 |
(79) |
|
3rd quarter |
|
286 |
(29) |
|
4th quarter |
|
|
507 |
|
Full year |
|
|
466 |
Financial result and net income
At minus €175 million, the financial result was slightly below the level of the third quarter of 2014 (minus €169 million) due to lower income from shareholdings.
At €1,714 million, income before taxes and minority interests was up by €141 million. The tax rate was 26.0% (third quarter of 2014: 27.6%).
Net income rose by €195 million to €1,209 million.
Earnings per share were €1.31 in the third quarter of 2015, compared with €1.11 in the same quarter of 2014. Adjusted for special items and amortization of intangible assets, earnings per share amounted to €1.07 (third quarter of 2014: €1.24).
|
Adjusted earnings per share (€) | |||
|---|---|---|---|
|
|
|
2015 |
2014 |
|
1st quarter |
|
1.43 |
1.63 |
|
2nd quarter |
|
1.49 |
1.53 |
|
3rd quarter |
|
1.07 |
1.24 |
|
4th quarter |
|
|
1.04 |
|
Full year |
|
|
5.44 |
1 Our chemicals business comprises the Chemicals, Performance Products and Functional Materials & Solutions segments.