Agricultural Solutions
3rd Quarter 2016
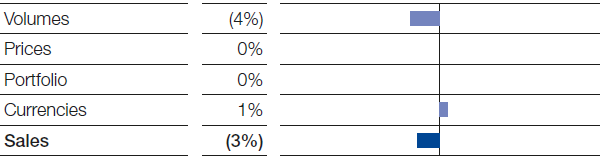
Sales declined slightly year-on-year in the Agricultural Solutions segment. Positive currency effects were unable to compensate for lower volumes. Prices matched the level of the previous third quarter.
Factors influencing sales, Agricultural Solutions
3rd Quarter 2016
In Europe, sales fell slightly, mainly as a result of negative currency effects from the British pound and slightly lower sales prices. Sales volumes grew especially in the herbicides business in western and northern Europe.
Sales decreased considerably in North America, essentially on account of lower sales prices. We were able to raise volumes, especially of the herbicides Kixor® and dicamba.
Sales also declined considerably in South America as a result of the ongoing difficult macroeconomic environment. High customers inventory levels, the weakened market for insecticides and the still-tense economic situation for farmers, especially in Brazil, all contributed to a considerable decline in sales volumes. Substantial price increases and currency effects both helped support sales.
We raised our sales considerably in Asia, thanks in particular to higher volumes in India. There – after a weak third quarter in 2015 – an increase in sales volumes for herbicides was the primary driver for sales growth.
Compared with the third quarter of 2015, income from operations before special items rose considerably in the Agricultural Solutions segment. This was mainly an effect of improved margins through a more favorable product mix in Europe, Asia and South America, as well as reduced fixed costs.
|
|
|
3rd Quarter |
January – September | ||||||||
|---|---|---|---|---|---|---|---|---|---|---|---|
|
|
|
2016 |
2015 |
Change % |
2016 |
2015 |
Change % | ||||
|
|||||||||||
|
Sales to third parties |
|
1,049 |
1,077 |
(3) |
4,288 |
4,653 |
(8) |
||||
|
Income from operations before depreciation and amortization (EBITDA) |
|
151 |
68 |
122 |
1,169 |
1,116 |
5 |
||||
|
Amortization, depreciation and impairments1 |
|
58 |
62 |
(6) |
198 |
172 |
15 |
||||
|
Income from operations (EBIT) |
|
93 |
6 |
. |
971 |
944 |
3 |
||||
|
Special items |
|
(4) |
(1) |
. |
(37) |
(2) |
. |
||||
|
Income from operations (EBIT) before special items |
|
97 |
7 |
. |
1,008 |
946 |
7 |
||||
|
Assets (September 30) |
|
8,117 |
7,719 |
5 |
8,117 |
7,719 |
5 |
||||
|
Investments2 |
|
55 |
102 |
(46) |
206 |
293 |
(30) |
||||
|
Research expenses |
|
116 |
124 |
(6) |
346 |
382 |
(9) |
||||