Oil & Gas
1st Quarter 2017
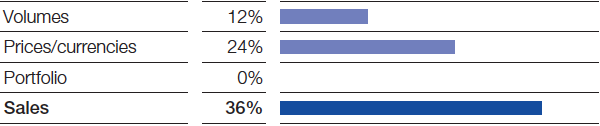
Sales in the Oil & Gas segment increased considerably year-on-year, mainly driven by higher prices. The price of a barrel of Brent blend crude oil averaged $54 in the first quarter of 2017 (first quarter of 2016: $34). Gas prices on European spot markets also rose sharply compared with the previous first quarter. Production volumes matched the level of the previous first quarter, while sales volumes, especially of gas, exceeded the level of the first quarter of 2016.
Factors influencing sales, Oil & Gas 1st Quarter 2017
Income from operations before special items also improved considerably. This was largely attributable to the rise in prices. Net income grew significantly.
|
|
1st Quarter |
||||||
|---|---|---|---|---|---|---|---|---|
|
|
2017 |
2016 |
Change % |
||||
|
||||||||
Sales to third parties |
|
829 |
611 |
36 |
||||
Income from operations before depreciation and amortization (EBITDA) |
|
482 |
307 |
57 |
||||
Amortization and depreciation1 |
|
313 |
241 |
30 |
||||
Income from operations (EBIT) |
|
169 |
66 |
156 |
||||
Special items |
|
(1) |
− |
− |
||||
EBIT before special items |
|
170 |
66 |
158 |
||||
Assets (March 31) |
|
12,667 |
12,147 |
4 |
||||
Investments including acquisitions2 |
|
180 |
280 |
(36) |
||||
Research and development expenses |
|
9 |
10 |
(10) |
||||
Exploration expenses |
|
10 |
33 |
(70) |
||||
Net income |
|
140 |
47 |
198 |
||||