Performance Products
1st Quarter 2017
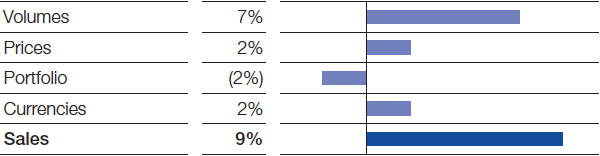
In the Performance Products segment, sales were considerably up compared with the first quarter of 2016. This was mainly the result of increased volumes in the Dispersions & Pigments, Care Chemicals and Performance Chemicals divisions. We experienced positive currency effects in all divisions and slightly raised sales prices overall. Portfolio effects dampened sales development. Income from operations (EBIT) before special items declined slightly compared with the solid level of the previous first quarter due to lower margins and higher fixed costs.
Factors influencing sales, Performance Products 1st Quarter 2017
Dispersions & Pigments
In the Dispersions & Pigments division, we achieved considerably higher sales than in the previous first quarter. This was mostly attributable to significant volumes growth in all business areas. Currency effects and slightly elevated prices also had a positive impact on sales. Sales were slightly dampened by the divestiture of the photoinitiator business in August 2016. EBIT before special items was considerably below the high level of the prior first quarter, owing to lower margins and slightly higher fixed costs. The margin decline was mainly brought about by rising raw material prices as well as the larger proportion of sales from the lower-margin dispersions business for paper coatings.
Care Chemicals
Sales in the Care Chemicals division considerably exceeded the level of the previous first quarter, primarily through increased volumes of ingredients for the detergents and cleaners industry as well as the stronger demand for oleochemical surfactants and fatty alcohols. Higher prices in connection with increased raw material prices, together with currency effects, also supported sales growth. EBIT before special items declined slightly compared with the first quarter of 2016. This was predominantly the result of lower margins in the hygiene business – driven downward by ongoing intense competition – as well as higher maintenance costs.
Nutrition & Health
Sales in the Nutrition & Health division matched the level of the previous first quarter. Portfolio effects dampened sales development. Volumes fell slightly: Increased volumes in the animal nutrition business were only partly able to offset declines in the other business areas. Sales were supported, however, by higher prices overall – especially for vitamins in the animal nutrition business – as well as by positive currency effects. EBIT before special items improved considerably on account of stronger margins.
Performance Chemicals
Sales in the Performance Chemicals division rose considerably compared with the first quarter of 2016. This was largely due to higher volumes in all business areas, especially plastic additives, as well as fuel and lubricant additives. Sales volumes increased in all regions, with Asia showing the fastest growth rates. Currency effects also provided a slight boost to sales, while slightly declining prices slowed sales development. EBIT before special items was considerably down year-on-year; the solid volumes growth was only partly able to compensate for lower margins.
|
|
|
1st Quarter | ||||||||
|---|---|---|---|---|---|---|---|---|---|---|
|
|
|
2017 |
2016 |
Change % | ||||||
|
||||||||||
|
Sales to third parties |
|
4,260 |
3,913 |
9 |
||||||
|
Thereof Dispersions & Pigments |
|
1,399 |
1,266 |
11 |
||||||
|
Care Chemicals |
|
1,362 |
1,204 |
13 |
||||||
|
Nutrition & Health |
|
486 |
488 |
0 |
||||||
|
Performance Chemicals |
|
1,013 |
955 |
6 |
||||||
|
Income from operations before depreciation and amortization (EBITDA) |
|
714 |
758 |
(6) |
||||||
|
Amortization and depreciation2 |
|
215 |
215 |
– |
||||||
|
Income from operations (EBIT) |
|
499 |
543 |
(8) |
||||||
|
Special items |
|
(16) |
(12) |
(33) |
||||||
|
EBIT before special items |
|
515 |
555 |
(7) |
||||||
|
Assets (March 31) |
|
15,404 |
14,558 |
6 |
||||||
|
Investments including acquisitions3 |
|
213 |
180 |
18 |
||||||
|
Research and development expenses |
|
93 |
99 |
(6) |
||||||