2nd Quarter 2017 Results: BASF Group
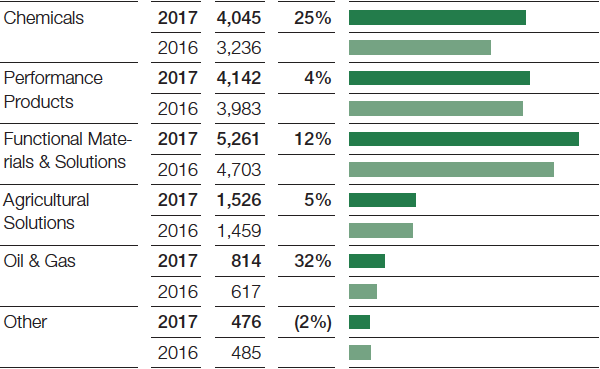
Compared with the second quarter of 2016, sales rose by €1,781 million to €16,264 million. We were able to increase sales prices and volumes. All segments except Chemicals contributed to this volumes growth. Currency effects and the Chemetall business acquired from Albemarle in December 2016 also had a positive impact on sales.
Factors influencing BASF Group sales, 2nd Quarter 2017

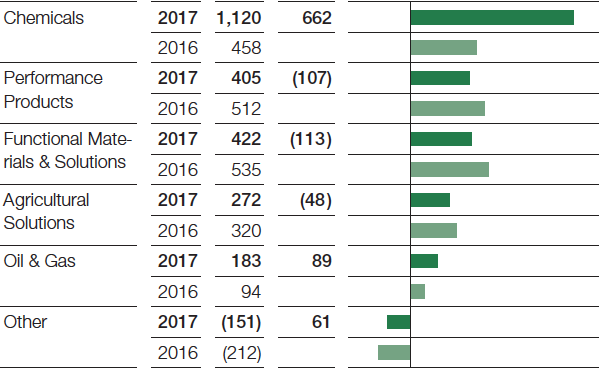
Income from operations (EBIT) before special items1 grew by €544 million year-on-year to €2,251 million, primarily as a result of the substantially improved contribution from the Chemicals segment. EBIT before special items also rose considerably in the Oil & Gas segment, while Performance Products, Functional Materials & Solutions and Agricultural Solutions all posted a considerable decline. Earnings in the chemicals business2 contained insurance payments of €100 million for the accident at the North Harbor of the Ludwigshafen site in October 2016, an amount which predominantly pertained to the Chemicals segment.
Special items in EBIT amounted to minus €70 million in the second quarter of 2017. These largely comprised expenses for restructuring measures and divestitures. Integration costs and other special charges also arose. In the same quarter of the previous year, special items amounted to €11 million. These contained gains on disposals, which were primarily contrasted by expenses for restructuring measures.
EBIT3 increased by €463 million to €2,181 million compared with the second quarter of 2016. Year-on-year, income from operations before depreciation, amortization and special items (EBITDA before special items)4 increased by €617 million to €3,291 million and EBITDA4 grew by €443 million to €3,233 million.
1 For an explanation of this figure, see the BASF Report 2016, Value-based management.
2 Our chemicals business comprises the Chemicals, Performance Products and Functional Materials & Solutions segments.
3 The calculation of income from operations (EBIT) is shown in the Statement of Income.
4 For an explanation of this figure, see the BASF Report 2016, Additional figures for results of operations.
|
|
2017 |
2016 |
|---|---|---|---|
EBIT |
|
2,181 |
1,718 |
– Special items |
|
(70) |
11 |
EBIT before special items |
|
2,251 |
1,707 |
+ Depreciation, amortization and valuation allowances on property, plant and equipment and intangible assets before special items |
|
1,040 |
967 |
EBITDA before special items |
|
3,291 |
2,674 |
|
|
2017 |
2016 |
|---|---|---|---|
EBIT |
|
2,181 |
1,718 |
+ Depreciation, amortization and valuation allowances on property, plant and equipment and intangible assets |
|
1,052 |
1,072 |
EBITDA |
|
3,233 |
2,790 |
Second-quarter sales
(Million €, relative change)

Second-quarter EBIT before special items
(Million €, absolute change)

At minus €174 million, the financial result was €3 million above the level of the second quarter of 2016. The interest result improved, while net income from shareholdings and other financial result declined.
Income before taxes and minority interests was up by €466 million to €2,007 million. At 22.1%, the tax rate was below that of the previous second quarter (26.9%) due in part to currency-related deferred tax income in Norway. Minority interests increased by €33 million to €68 million.
At €1,496 million, net income exceeded the previous second-quarter level by €404 million.
Earnings per share were €1.63 in the second quarter of 2017, compared with €1.19 in the same quarter of the previous year. Earnings per share adjusted5 for special items as well as amortization of and valuation allowances on intangible assets amounted to €1.78 (same period of 2016: €1.30).
5 For an explanation of this figure, see the BASF Report 2016, Additional figures for results of operations.
|
|
|
2017 |
2016 |
|---|---|---|---|---|
Income before taxes and minority interests |
|
|
2,007 |
1,541 |
– Special items |
|
|
(70) |
11 |
+ Amortization and valuation allowances on intangible assets |
|
|
142 |
167 |
– Amortization and valuation allowances on intangible assets contained in special items |
|
|
− |
42 |
Adjusted income before taxes and minority interests |
|
|
2,219 |
1,655 |
– Adjusted income taxes |
|
|
512 |
428 |
Adjusted income before minority interests |
|
|
1,707 |
1,227 |
– Adjusted minority interests |
|
|
69 |
36 |
Adjusted net income |
|
|
1,638 |
1,191 |
Weighted average number of outstanding shares |
|
in thousands |
918,479 |
918,479 |
Adjusted earnings per share |
|
€ |
1.78 |
1.30 |
Cash provided by operating activities improved from €2,293 million in the second quarter of 2016 to €2,969 million in the second quarter of 2017, primarily due to the increase in net income. The higher amount of cash released from changes in net working capital as compared with the previous year – especially trade accounts receivable – also contributed to this development. Furthermore, positive effects arose from the change in miscellaneous items that was brought about by the previous second quarter’s greater reclassifications of disposal gains to cash provided by investing activities as well as BASF SE’s assumption of pension payments.
Cash used in investing activities in the second quarter of 2017 amounted to minus €1,150 million, compared with minus €730 million in the second quarter of the prior year. Higher loan receivables led to tied-down cash, whereas their decline in the previous second quarter had released cash. Moreover, payments received for the disposal of property, plant and equipment and intangible assets were lower year-on-year. By contrast, €875 million was paid for property, plant and equipment and intangible assets, an amount €103 million lower than in the second quarter of 2016.
In the second quarter of 2017, cash used in financing activities amounted to minus €1,717 million, compared with minus €3,811 million in the second quarter of 2016. This was mainly the result of a change in financial indebtedness: Cash inflows in the second quarter of 2017 arising primarily from an increase in liabilities to credit institutions were contrasted by cash outflows in the previous second quarter arising predominantly from the scaling back of the U.S. dollar commercial paper program. Dividends of €2,755 million were paid to shareholders of BASF SE, which was €91 million more than in the previous second quarter. Minority shareholders of Group companies received €88 million in dividends, representing a decrease of €12 million.
Free cash flow amounted to €2,094 million, compared with €1,315 million in the same quarter of the previous year. Both the higher level of cash provided by operating activities and the lower level of payments made for property, plant and equipment and intangible assets contributed to this improvement.
|
|
2017 |
2016 |
|---|---|---|---|
Cash provided by operating activities |
|
2,969 |
2,293 |
– Payments made for property, plant and equipment and intangible assets |
|
875 |
978 |
Free cash flow |
|
2,094 |
1,315 |