Chart Gallery
-
Long-term performance of BASF shares compared with indexes Average annual increase with dividends reinvested
Go to corresponding page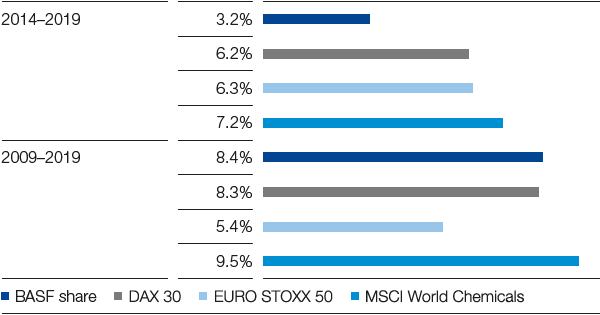
-
Dividend per share € per share
Go to corresponding page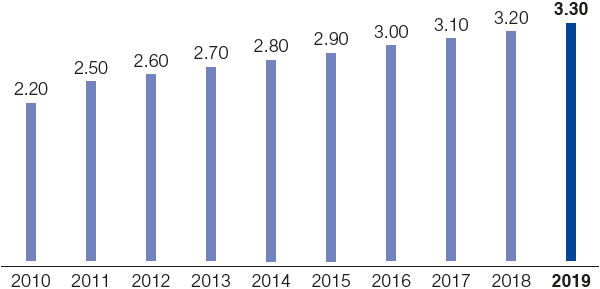
-
Shareholder structure By region, rounded
Go to corresponding page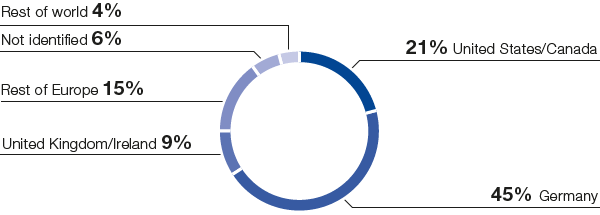
-
BASF sales by region 2019 Location of customer
Go to corresponding page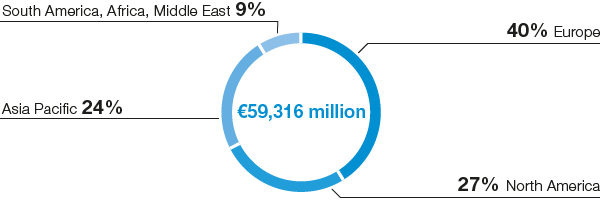
-
Research and development expenses by segment 2019
Go to corresponding page
-
BASF Group donations, sponsorship and own projects in 2019a
a Figure relates to all consolidated companies with employees including joint operations Go to corresponding page
-
Additions to property, plant and equipmenta by segment in 2019
a Including restoration obligations, IT investments and right-of-use assets arising from leases Go to corresponding page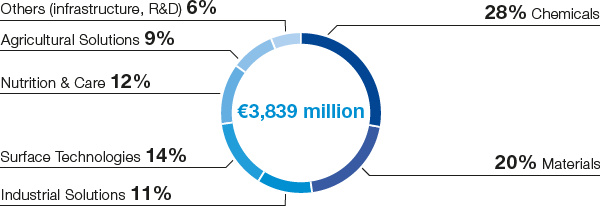
-
Additions to property, plant and equipmenta by region in 2019
a Including restoration obligations, IT investments and right-of-use assets arising from leases Go to corresponding page
-
Gross domestic product Real change compared with previous year
Go to corresponding page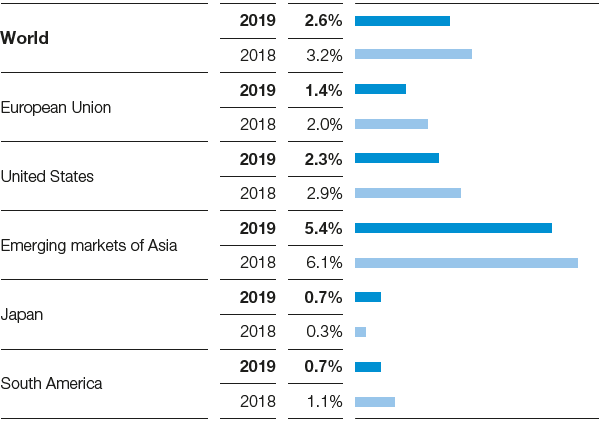
-
Growth in key customer industries Real change compared with previous year
Go to corresponding page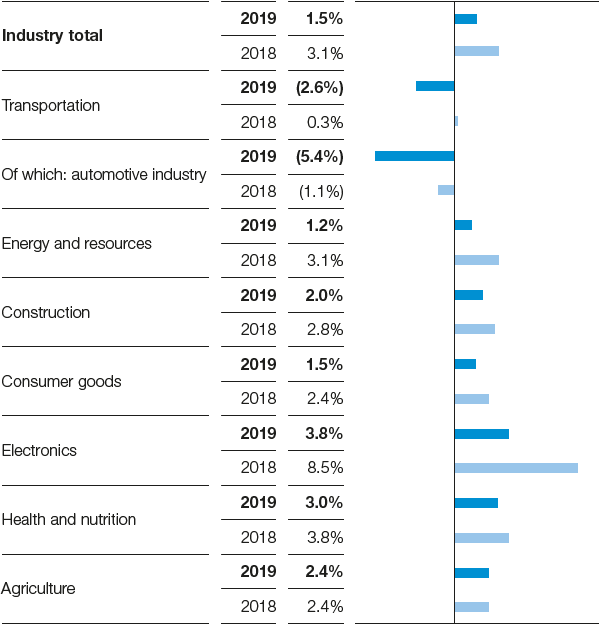
-
Chemical production (excluding pharmaceuticals) Real change compared with previous year
Go to corresponding page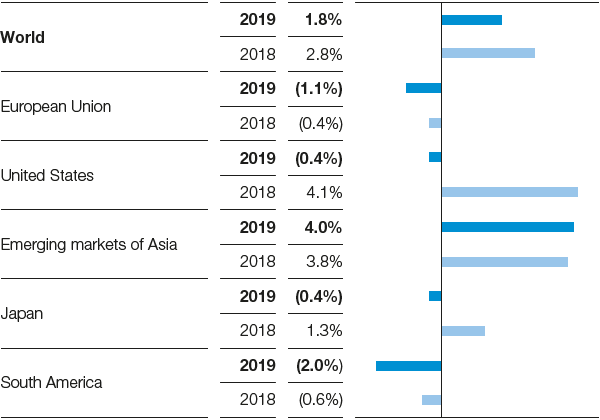
-
Salesa, b Million €
a Sales for 2018 were reduced by the share attributable to construction chemicals activities due to their presentation as discontinued operations. Figures for the years 2015 to 2017 have not been restated.
b Sales for 2017 were reduced by the share attributable to oil and gas activities due to their presentation as discontinued operations. Figures for the years 2015 to 2016 have not been restated. Go to corresponding page -
EBIT before special itemsa, b Million €
a EBIT before special items for 2018 was reduced by the share attributable to construction chemicals activities due to their presentation as discontinued operations. Figures for the years 2015 to 2017 have not been restated. b EBIT before special items for 2017 was reduced by the share attributable to oil and gas activities due to their presentation as discontinued operations. Figures for the years 2015 to 2016 have not been restated. Go to corresponding page
-
EBITa, b Million €
a EBIT for 2018 was reduced by the share attributable to construction chemicals activities due to their presentation as discontinued operations. Figures for the years 2015 to 2017 have not been restated. b EBIT for 2017 was reduced by the share attributable to oil and gas activities due to their presentation as discontinued operations. Figures for the years 2015 to 2016 have not been restated. Go to corresponding page
-
Maturities of financial indebtedness
Go to corresponding page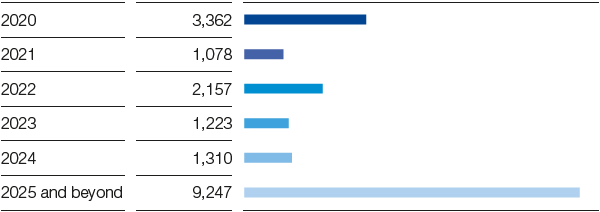
-
Financing instruments Million €
Go to corresponding page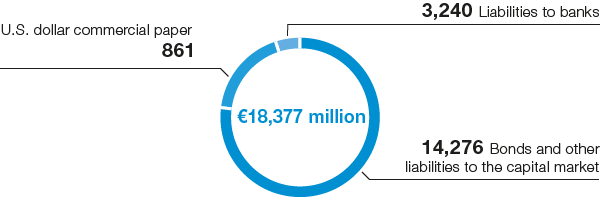
-
Cash flow Billion €
Go to corresponding page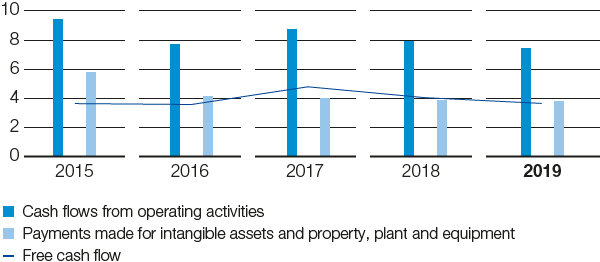
-
Contributions to total sales by segment
Go to corresponding page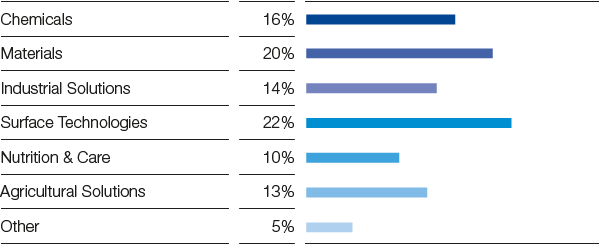
-
Contributions to EBITDA by segment
Go to corresponding page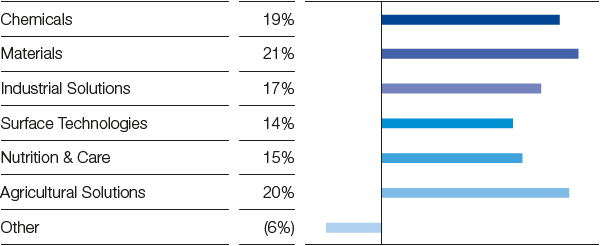
-
Contributions to EBIT before special items by segment
Go to corresponding page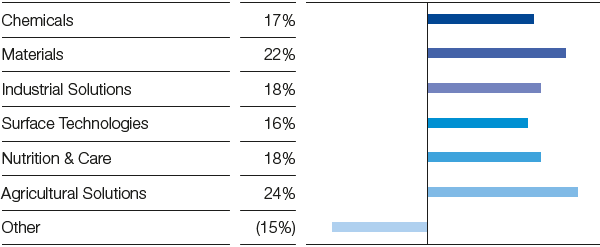
-
Contributions to EBIT by segment
Go to corresponding page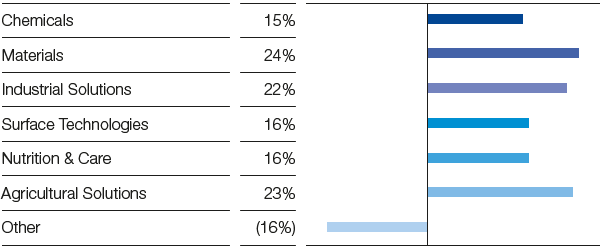
-
Factors influencing sales
Go to corresponding page
-
Income from operations before special items Million €
Go to corresponding page
-
Petrochemicals – Sales by region Location of customer
Go to corresponding page
-
Intermediates – Sales by region Location of customer
Go to corresponding page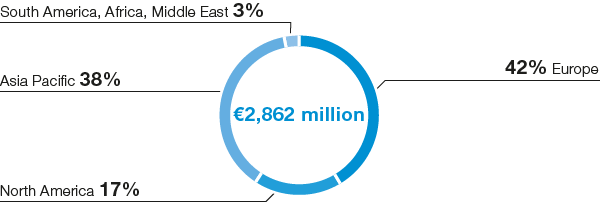
-
Factors influencing sales
Go to corresponding page
-
Income from operations before special items Million €
Go to corresponding page
-
Performance Materials – Sales by region Location of customer
Go to corresponding page
-
Monomers – Sales by region Location of customer
Go to corresponding page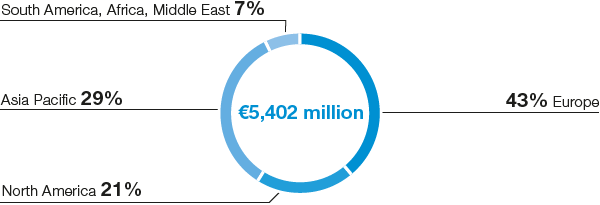
-
Factors influencing sales
Go to corresponding page
-
Income from operations before special items Million €
Go to corresponding page
-
Dispersions & Pigments – Sales by region Location of customer
Go to corresponding page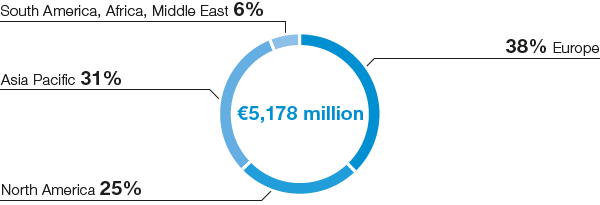
-
Performance Chemicals – Sales by region Location of customer
Go to corresponding page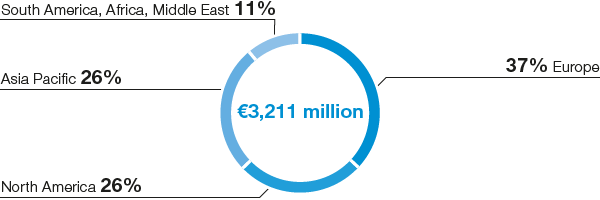
-
Factors influencing sales
Go to corresponding page
-
Income from operations before special items Million €
Go to corresponding page
-
Catalysts – Sales by region Location of customer
Go to corresponding page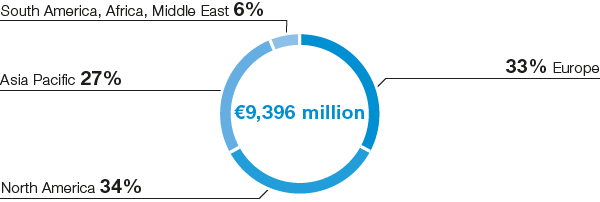
-
Coatings – Sales by region Location of customer
Go to corresponding page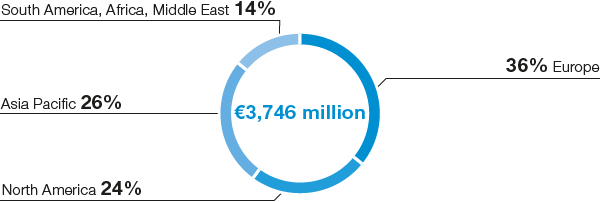
-
Factors influencing sales
Go to corresponding page
-
Income from operations before special items Million €
Go to corresponding page
-
Care Chemicals – Sales by region Location of customer
Go to corresponding page
-
Nutrition & Health – Sales by region Location of customer
Go to corresponding page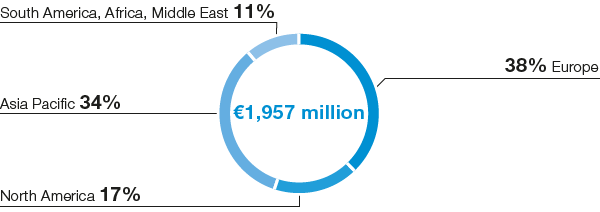
-
Factors influencing sales
Go to corresponding page
-
Income from operations before special items Million €
Go to corresponding page
-
Agricultural Solutions – Sales by region Location of customer
Go to corresponding page
-
Sales by region Location of company
Go to corresponding page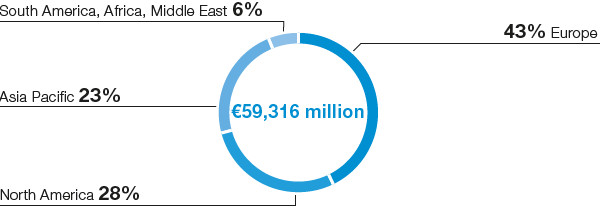
-
Income from operations by region Location of company
Go to corresponding page
-
Greenhouse gas emissions from BASF operations (excluding sale of energy to third parties) compared with baseline 2018 %
Go to corresponding page
-
Specific greenhouse gas emissions from BASF operations4 Metric tons of CO2 equivalents per metric ton of sales product3
3 Sales product volumes include sales between BASF Group companies; merchandise is not taken into account. 4 We have changed the method used to calculate the relevant environmental indicators compared with the previous year. Further information can be found above. The figures for 2018 have been adjusted according to the new method. Go to corresponding page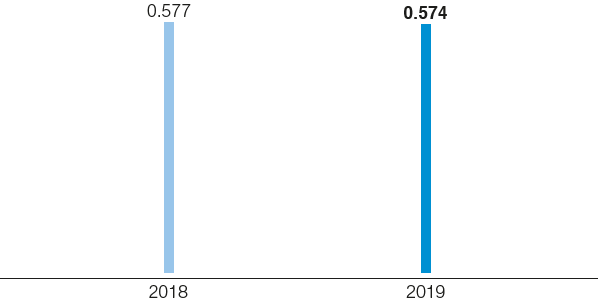
-
Certified energy management systems (ISO 50001) at BASF Group sites worldwide, in terms of primary energy demand4 %
4 We have changed the method used to calculate the relevant environmental indicators compared with the previous year. Further information can be found above. The figures for 2018 have been adjusted according to the new method. Go to corresponding page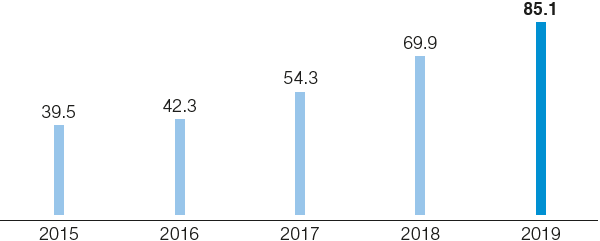
-
Greenhouse gas emissions along the BASF value chain in 2019a Million metric tons of CO2 equivalents
a According to Greenhouse Gas Protocol; Scope 1, 2 and 3; categories within Scope 3 are shown in parentheses. For more information on Scope 3 emissions reporting, see basf.com/corporate_carbon_footprint Go to corresponding page
-
BASF Group employee age structure (Total: 117,628, of which 25.1% women, as of December 31, 2019)
Go to corresponding page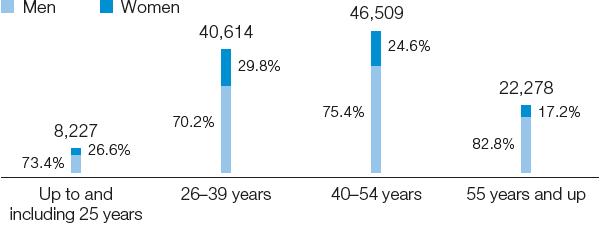
-
Outlook for gross domestic product 2020 Real change compared with previous year
Go to corresponding page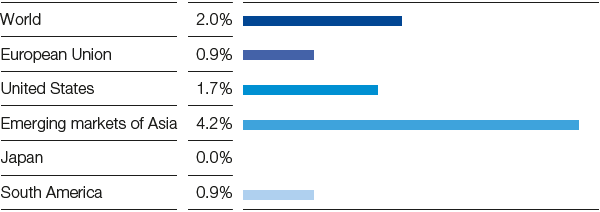
-
Trends in gross domestic product 2020–2022 Average annual real change
Go to corresponding page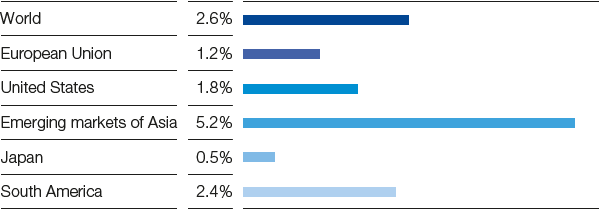
-
Outlook for chemical production 2020 (excluding pharmaceuticals) Real change compared with previous year
Go to corresponding page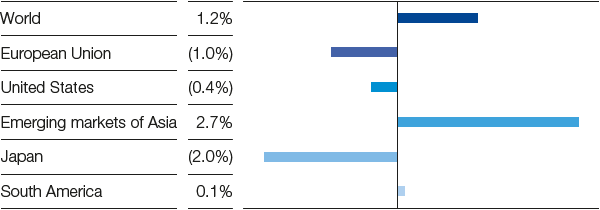
-
Trends in chemical production 2020–2022 (excluding pharmaceuticals) Real change compared with previous year
Go to corresponding page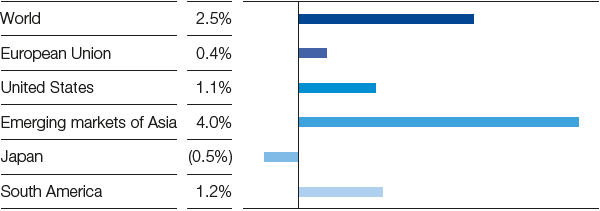
-
Capex by segment 2020–2024
Go to corresponding page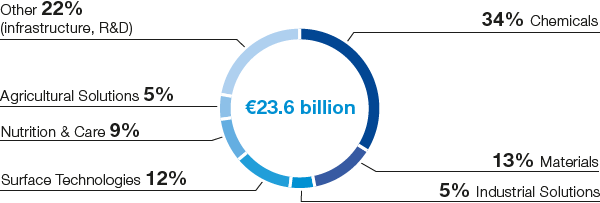
-
Capex by region 2020–2024
Go to corresponding page