Results of Operations, Net Assets, Financial Position
Results of Operations
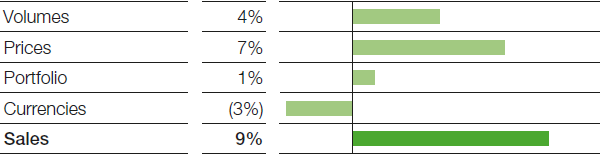
BASF Group sales rose by €1,242 million compared with the prior-year quarter to €15,255 million. This was primarily attributable to good volumes development as well as significantly higher sales prices in the Chemicals segment. Sales were also lifted by the Chemetall business, acquired in December 2016. All segments recorded slightly negative currency effects.
Factors influencing BASF Group sales, 3rd Quarter 2017
The strong contribution from the Chemicals segment lifted income from operations (EBIT) before special items1 by €244 million to €1,760 million. We recorded a slight decrease in EBIT before special items in the Oil & Gas segment and a considerable decline in the remaining segments and in Other. EBIT before special items in the chemicals business2 grew by €426 million to €1,884 million. This included insurance payments of €60 million for the accident at the North Harbor of the Ludwigshafen site in October 2016, an amount that predominantly pertained to the Chemicals segment.
Special items in EBIT totaled €198 million in the third quarter of 2017, compared with minus €52 million in the prior-year quarter. This was mainly due to special income of €203 million in the Performance Products segment from the transfer of BASF’s leather chemicals business to the Stahl group. The figure for the third quarter of 2016 primarily related to expenses for restructuring measures.
EBIT3 rose by €494 million compared with the third quarter of 2016 to €1,958 million.
Compared with the prior-year quarter, income from operations before depreciation, amortization and special items (EBITDA before special items)4 increased by €303 million to €2,793 million and EBITDA4 by €570 million to €3,007 million.
1 For an explanation of this figure, see the BASF Report 2016, Value-based management.
2 Our chemicals business comprises the Chemicals, Performance Products and Functional Materials & Solutions segments.
3 The calculation of income from operations (EBIT) is shown in the Statement of Income.
4 For an explanation of this figure, see the BASF Report 2016, Additional figures for results of operations.
|
|
|
2017 |
2016 |
|---|---|---|---|
|
EBIT |
|
1,958 |
1,464 |
|
– Special items |
|
198 |
(52) |
|
EBIT before special items |
|
1,760 |
1,516 |
|
+ Depreciation, amortization and valuation allowances on property, plant and equipment and intangible assets before special items |
|
1,033 |
974 |
|
EBITDA before special items |
|
2,793 |
2,490 |
|
|
|
2017 |
2016 |
|---|---|---|---|
|
EBIT |
|
1,958 |
1,464 |
|
+ Depreciation, amortization and valuation allowances on property, plant and equipment and intangible assets |
|
1,049 |
973 |
|
EBITDA |
|
3,007 |
2,437 |
The financial result improved by €98 million to minus €185 million. This was predominantly an effect of lower interest expenses and higher interest income.
Income before taxes and minority interests rose by €592 million to €1,773 million. The tax rate increased from 17.3% to 20.5%. This was primarily due to the reversal of provisions for taxes in the previous year as well as an increase in earnings contributions from countries with higher tax rates. Minority interests declined by €16 million to €73 million.
Net income rose by €448 million to €1,336 million.
Earnings per share were €1.45 in the third quarter of 2017, compared with €0.97 in the prior-year quarter. Earnings per share adjusted5 for special items and amortization of intangible assets amounted to €1.40 (prior-year quarter: €1.10).
5 For an explanation of this figure, see the BASF Report 2016, Additional figures for results of operations.
|
|
|
|
2017 |
2016 |
|---|---|---|---|---|
|
Income before taxes and minority interests |
|
|
1,773 |
1,181 |
|
– Special items |
|
|
198 |
(52) |
|
+ Amortization and valuation allowances on intangible assets |
|
|
134 |
122 |
|
– Amortization and valuation allowances on intangible assets contained in special items |
|
|
(4) |
− |
|
Adjusted income before taxes and minority interests |
|
|
1,713 |
1,355 |
|
– Adjusted income taxes |
|
|
353 |
254 |
|
Adjusted income before minority interests |
|
|
1,360 |
1,101 |
|
– Adjusted minority interests |
|
|
69 |
87 |
|
Adjusted net income |
|
|
1,291 |
1,014 |
|
Weighted average number of outstanding shares |
|
in thousands |
918,479 |
918,479 |
|
Adjusted earnings per share |
|
€ |
1.40 |
1.10 |
Net Assets
At €76,023 million, total assets were down on the 2016 year-end figure (€76,496 million). Noncurrent assets declined by €2,960 million to €47,590 million, mainly due to lower property, plant and equipment and intangible assets. This was largely the result of amortization, depreciation and impairments that exceeded the level of investments as well as currency effects. The €2,487 million increase in current assets to €28,433 million was primarily attributable to higher cash and cash equivalents.
Financial Position
Equity increased from €32,568 million to €33,341 million compared with December 31, 2016. Income before minority interests exceeded the dividend payment by €1.8 billion. By contrast, other comprehensive income declined; actuarial gains were more than offset by negative currency translation effects. The equity ratio rose from 42.6% to 43.9%.
Noncurrent liabilities declined from €28,611 million to €28,405 million. This was primarily due to the €1,412 million decrease in provisions for pensions and similar obligations, particularly as a result of actuarial gains. Other contributing factors included the decline in deferred tax liabilities and other provisions. The €1,701 million increase in noncurrent financial indebtedness had an offsetting effect. This was predominantly the result of the bonds issued in the first half of the year, which had a nominal value of €1.9 billion.
Current liabilities declined from €15,317 million to €14,277 million, mainly due to the €1,799 million decrease in current financial indebtedness. This was primarily brought about by the scaling back of the U.S. dollar commercial paper program and lower liabilities to credit institutions. This development was contrasted especially by higher provisions and other liabilities.
Overall, financial indebtedness decreased by €98 million to €16,214 million. Net debt6 declined by €2,133 million as against December 31, 2016, to €12,268 million.
6 For an explanation of this figure, see the BASF Report 2016, Financial position.
|
|
|
Sep. 30, 2017 |
Dec. 31, 2016 |
|---|---|---|---|
|
Noncurrent financial indebtedness |
|
14,246 |
12,545 |
|
+ Current financial indebtedness |
|
1,968 |
3,767 |
|
Financial indebtedness |
|
16,214 |
16,312 |
|
– Marketable securities |
|
27 |
536 |
|
– Cash and cash equivalents |
|
3,919 |
1,375 |
|
Net debt |
|
12,268 |
14,401 |
At €3,795 million, cash provided by operating activities in the third quarter of 2017 was up by €1,294 million on the prior-year figure, predominantly due to the rise in net income as well as the larger amount of released funds from net working capital. The latter was especially driven by the sharper increase in operating liabilities and other provisions.
Cash used in investing activities amounted to €1,048 million in the third quarter of 2017, compared with €788 million in the same quarter of the previous year. The lower level of net payments received from acquisitions and divestitures year-on-year was one contributing factor, along with the higher amount of cash tied down in financing-related receivables. At €964 million, payments made for property, plant and equipment and intangible assets were slightly above the level of the third quarter of 2016.
Cash used in financing activities amounted to €660 million in the third quarter of 2017, compared with €84 million in the same quarter of the previous year. This was largely due to the increased repayment of financial indebtedness, especially as a result of the scaling back of BASF SE’s U.S. dollar commercial paper program.
Free cash flow amounted to €2,831 million, compared with €1,565 million in the same quarter of 2016. The increase was attributable to the higher amount of cash provided by operating activities.
|
|
|
2017 |
2016 |
|---|---|---|---|
|
Cash provided by operating activities |
|
3,795 |
2,501 |
|
– Payments made for property, plant and equipment and intangible assets |
|
964 |
936 |
|
Free cash flow |
|
2,831 |
1,565 |
Our ratings have remained unchanged since the publication of the BASF Report 2016. Rated “A1/P-1/outlook stable” by Moody’s, “A/A-1/outlook stable” by Standard & Poor’s and “A/S-1/outlook stable” by Scope, BASF enjoys good credit ratings, especially compared with competitors in the chemical industry. These ratings were last confirmed in October 2017 (Moody’s: October 17; Standard & Poor’s: October 18; Scope: October 18).