Results of Operations, Net Assets, Financial Position
Results of Operations
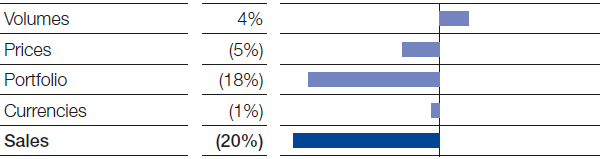
Compared with the third quarter of 2015, sales declined by €3,411 million to €14,013 million, mainly as a result of the divestiture of the gas trading and storage business as part of the asset swap with Gazprom at the end of September 2015. This business had contributed €2.9 billion to sales in the third quarter of 2015. In addition, lower raw material prices led to a drop in sales prices, reducing sales in the chemicals business1 – especially in the Chemicals segment – and in the Oil & Gas segment. We raised volumes by 4%, primarily supported by the Functional Materials & Solutions and Chemicals segments.
Factors influencing sales, BASF Group 3rd Quarter 2016
Income from operations (EBIT) before special items2 declined by €87 million to €1,516 million, primarily as a result of smaller contributions from the Oil & Gas segment and from Other. In the chemicals business and Agricultural Solutions segment, however, we were able to increase EBIT before special items.
In the third quarter of 2016, special items in EBIT were minus €52 million compared with €286 million in the previous third quarter. This was largely the result of expenses from restructuring measures. The third quarter of 2015 had particularly included income from the asset swap with Gazprom.
Compared with the previous third quarter, EBIT declined from €1,889 million to €1,464 million. EBITDA2 decreased to €2,437 million, compared with €2,872 million in the same period of the prior year.
At minus €283 million, the financial result was €108 million below the level of the third quarter of 2015. Net income from shareholdings fell by €33 million to minus €39 million due to the write-down of shares in a subsidiary. The interest result declined by €38 million to minus €143 million, primarily as a consequence of higher interest expenses in conjunction with new bank loans outside the eurozone. The €37 million reduction to minus €101 million in other financial result was due in part to lower income from construction interest as well as higher hedging costs.
Income before taxes and minority interests declined from €1,714 million in the previous third quarter to €1,181 million. The tax rate decreased from 26.0% to 17.3%, mainly owing to the release of tax provisions for previous years as well as higher income from deferred taxes in the Oil & Gas segment. The latter resulted from the currency-driven decrease in temporary differences to the values used for the calculation of taxable income in Norway.
Net income fell from €1,209 million to €888 million.
Earnings per share2 were €0.97 in the third quarter of 2016, compared with €1.31 in the same quarter of 2015. Adjusted for special items and amortization of intangible assets, earnings per share amounted to €1.10 (third quarter of 2015: €1.07).
1 Our chemicals business comprises the Chemicals, Performance Products and Functional Materials & Solutions segments.
2 For more information on this KPI, see Alternative Performance Measures.
Net Assets
Compared with the end of 2015, total assets rose from €70,836 million to €73,103 million. At €46,455 million, noncurrent assets matched the level of December 31, 2015. The increase in current assets from €24,566 million to €26,648 million was especially driven by a higher level of cash and cash equivalents in connection with the planned acquisition of Chemetall. Inventories and trade accounts receivable rose only marginally.
Financial Position
Compared with December 31, 2015, equity declined from €31,545 million to €29,737 million. The equity ratio decreased from 44.5% to 40.7%.
Noncurrent liabilities rose from €25,055 million to €27,379 million. This was largely due to higher provisions for pensions and similar obligations, caused by the decline in the discount rates in all relevant currency zones.
Current liabilities rose from €14,236 million to €15,987 million, mainly because of an increase in financial indebtedness: In addition to reclassifications of long-term financial indebtedness, this was predominantly from the expansion of the U.S. dollar commercial paper program.
Financial indebtedness increased overall by €600 million to €15,797 million. Because cash and cash equivalents rose at the same time by €1,219 million to €3,460 million, net debt1 declined from €12,956 million on December 31, 2015, to €12,337 million.
At €2,501 million, cash provided by operating activities in the third quarter of 2016 was €850 million below the level of the previous third quarter. The release of funds in net working capital in the third quarter of 2016 was primarily related to a seasonal decline in trade accounts receivable. The same quarter of the previous year had seen a higher level of funds released from trade accounts receivable as well as from other operating receivables.
Cash used in investing activities amounted to €788 million in the third quarter of 2016 compared with €1,624 million in the same quarter of the previous year. At €936 million, payments related to property, plant and equipment and intangible assets were lower year-on-year (third quarter of 2015: €1,542 million).
Cash used in financing activities amounted to €84 million, compared with €2,471 million in the third quarter of 2015. Cash outflow in the previous third quarter had been mainly the result of scaling back BASF SE’s U.S. dollar commercial paper program in the amount of nearly €2 billion.
Free cash flow2 amounted to €1,565 million, compared with €1,809 million in the same period of the prior year.
Rated “A1/P-1 outlook stable” by Moody’s and “A/A-1 outlook stable” by Standard & Poor’s, BASF enjoys good credit ratings, especially compared with competitors in the chemical industry. Scope Ratings has also been evaluating our creditworthiness since September 2016. The agency, which focuses on European companies, rates BASF at “A/S-1 outlook stable.”
In September 2016, BASF issued two bonds with a value date of October 6: one with a nominal value of €500 million, a 0.875% coupon and maturity of 15 years, the other with a nominal value of £250 million, a 0.875% coupon and maturity of seven years.
1 Net debt is calculated by subtracting cash and cash equivalents from current and noncurrent financial indebtedness. This balance-related indicator provides information on effective indebtedness. The values of its components are provided in the Balance Sheet.
2 Free cash flow is derived by subtracting payments related to property, plant and equipment and intangible assets from cash provided by operating activities. It provides information on cash flow available after investing activities. The values of its components are provided in the Cash Flow Statement.