Performance Products
3rd Quarter 2016
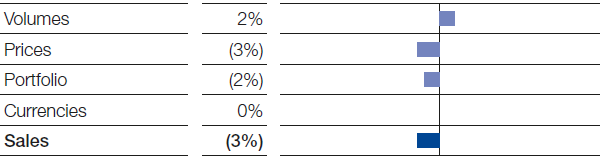
In the Performance Products segment, sales were slightly below the level of the third quarter of 2015. Prices fell, owing particularly to the oil-price-related reduction in raw material costs, as well as ongoing pressure on prices in the hygiene business. The 2015 divestiture of parts of our pharmaceutical ingredients and services business and sale of the paper hydrous kaolin business also dampened sales development. All divisions raised their sales volumes. As a result of this and of significantly reduced fixed costs, as well as improved margins overall, we were able to considerably boost income from operations (EBIT) before special items.
Factors influencing sales, Performance Products
3rd Quarter 2016
Dispersions & Pigments
In the Dispersions & Pigments division, sales were slightly below the level of the previous third quarter. This was essentially due to lower price levels resulting from decreased raw material prices. We were able to slightly raise sales volumes overall. A slight volumes decline in the resins business after the closure of our production plant in Kankakee, Illinois, was more than offset by volumes growth in all other business areas. Reduced fixed costs and overall margin and volumes improvement enabled us to achieve a considerable increase in EBIT before special items.
Care Chemicals
Sales in the Care Chemicals division were slightly down compared with the third quarter of 2015. This was predominantly the result of price declines brought about by lower raw material prices, although intense competition in the hygiene business was also a factor. Sales volumes rose especially through higher volumes of ingredients for the detergents and cleaners industry. Our strict cost discipline contributed decisively toward reducing fixed costs, more than compensating for slightly reduced margins. As a result, we were able to considerably improve EBIT before special items.
Nutrition & Health
In the Nutrition & Health division, sales rose slightly compared with the third quarter of the previous year. Volumes grew in all business areas, especially pharmaceuticals and animal nutrition. We were also able to significantly raise price levels overall, particularly through considerable price increases for vitamins in the animal nutrition business. The sale of parts of the pharmaceutical ingredients and services business in October 2015 slowed sales growth. EBIT before special items improved considerably thanks to significantly reduced fixed costs and higher volumes and margins. Restructuring measures were the main driver behind this cost reduction. Improved capacity utilization at our production facilities also contributed.
Performance Chemicals
Sales were considerably down in the Performance Chemicals division compared with the previous third quarter. This was largely a consequence of sales price reductions due to a sharp drop in raw material prices, as well as the sale of our paper hydrous kaolin business in the fourth quarter of 2015. Sales volumes rose slightly, and saw particular growth in the plastic additives business. EBIT before special items improved slightly as a result of the higher volumes, as well as of a reduction in fixed costs. We achieved this primarily through restructuring measures and strict cost discipline.
|
|
|
3rd Quarter |
January – September | ||||||||
|---|---|---|---|---|---|---|---|---|---|---|---|
|
|
|
2016 |
2015 |
Change % |
2016 |
2015 |
Change % | ||||
|
|||||||||||
|
Sales to third parties |
|
3,771 |
3,899 |
(3) |
11,400 |
12,021 |
(5) |
||||
|
Thereof Dispersions & Pigments |
|
1,147 |
1,176 |
(2) |
3,496 |
3,586 |
(3) |
||||
|
Care Chemicals |
|
1,175 |
1,218 |
(4) |
3,557 |
3,732 |
(5) |
||||
|
Nutrition & Health |
|
504 |
496 |
2 |
1,489 |
1,569 |
(5) |
||||
|
Performance Chemicals |
|
945 |
1,009 |
(6) |
2,858 |
3,134 |
(9) |
||||
|
Income from operations before depreciation and amortization (EBITDA) |
|
673 |
552 |
22 |
2,108 |
1,862 |
13 |
||||
|
Amortization, depreciation and impairments1 |
|
215 |
237 |
(9) |
629 |
688 |
(9) |
||||
|
Income from operations (EBIT) |
|
458 |
315 |
45 |
1,479 |
1,174 |
26 |
||||
|
Special items |
|
(6) |
(4) |
(50) |
(35) |
36 |
. |
||||
|
Income from operations (EBIT) before special items |
|
464 |
319 |
45 |
1,514 |
1,138 |
33 |
||||
|
Assets (September 30) |
|
14,328 |
14,463 |
(1) |
14,328 |
14,463 |
(1) |
||||
|
Investments2 |
|
194 |
255 |
(24) |
562 |
706 |
(20) |
||||
|
Research expenses |
|
85 |
94 |
(10) |
262 |
283 |
(7) |
||||