Functional Materials & Solutions
3rd Quarter 2016
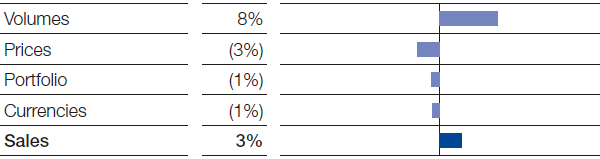
In the Functional Materials & Solutions segment, increased volumes led to slight sales growth compared with the third quarter of 2015. Volumes especially rose in our business with the automotive industry. Demand from the construction industry remained at an overall high level. Lower prices, negative currency effects and the divesiture of the global polyolefin catalysts business slightly dampened sales. As a result of the higher volumes and reduced fixed costs, income from operations (EBIT) before special items grew considerably.
Factors influencing sales, Functional Materials & Solutions
3rd Quarter 2016
Catalysts
Thanks to increased sales volumes, we achieved slight sales growth in the Catalysts division compared with the previous third quarter. Demand developed especially favorably in the mobile emissions catalysts business. Sales were dampened by lower prices, the divestiture of the polyolefin catalysts business in June 2016, and negative currency effects. In precious metal trading, higher volumes led to a sales increase to €614 million (third quarter of 2015: €538 million). As a result of improved volumes and reduced fixed costs, EBIT before special items grew considerably overall.
Construction Chemicals
Sales in the Construction Chemicals division declined slightly compared with the third quarter of 2015, largely weighed down by price decreases and negative currency effects. Volumes rose slightly, thanks especially to higher volumes in Europe, North America and Asia. Demand fell sharply in the region South America, Africa, Middle East, predominantly in Saudi Arabia, as public construction contracts declined in light of the falling price of oil. EBIT before special items was slightly below the level of the previous third quarter, mainly as a result of valuation allowances on receivables.
Coatings
We raised sales slightly in the Coatings division compared with the third quarter of 2015. This was primarily attributable to higher volumes, supported in large part by the automotive OEM coatings business. Slightly negative currency effects dampened sales development, while prices remained stable. In the automotive OEM coatings business, the increase in sales volumes in Asia and North America led to sales growth. Sales also rose in the decorative paints business, while they matched prior third-quarter levels for industrial coatings. We observed a slight sales decline in automotive refinish coatings. We were able to considerably raise EBIT before special items, mainly due to the volumes growth.
Performance Materials
Increased volumes in all business areas, especially in Asia, led to slight sales growth in the Performance Materials division. Our business with the automotive and construction industries contributed significantly to the positive volumes development, while demand matched prior third-quarter levels in the consumer goods sector. We observed lower sales prices in all regions on account of falling raw material prices. Currency effects and portfolio measures also slightly dampened sales growth. EBIT before special items rose considerably thanks to higher volumes and margins, as well as reduced fixed costs.
|
|
|
3rd Quarter |
January – September | ||||||||
|---|---|---|---|---|---|---|---|---|---|---|---|
|
|
|
2016 |
2015 |
Change % |
2016 |
2015 |
Change % | ||||
|
|||||||||||
|
Sales to third parties |
|
4,660 |
4,517 |
3 |
13,771 |
14,017 |
(2) |
||||
|
Thereof Catalysts |
|
1,552 |
1,472 |
5 |
4,527 |
4,761 |
(5) |
||||
|
Construction Chemicals |
|
606 |
614 |
(1) |
1,768 |
1,742 |
1 |
||||
|
Coatings |
|
790 |
753 |
5 |
2,328 |
2,357 |
(1) |
||||
|
Performance Materials |
|
1,712 |
1,678 |
2 |
5,148 |
5,157 |
0 |
||||
|
Income from operations before depreciation and amortization (EBITDA) |
|
631 |
510 |
24 |
1,981 |
1,708 |
16 |
||||
|
Amortization, depreciation and impairments1 |
|
139 |
144 |
(3) |
506 |
467 |
8 |
||||
|
Income from operations (EBIT) |
|
492 |
366 |
34 |
1,475 |
1,241 |
19 |
||||
|
Special items |
|
(5) |
(5) |
– |
(13) |
(19) |
32 |
||||
|
Income from operations (EBIT) before special items |
|
497 |
371 |
34 |
1,488 |
1,260 |
18 |
||||
|
Assets (September 30) |
|
13,804 |
13,383 |
3 |
13,804 |
13,383 |
3 |
||||
|
Investments2 |
|
184 |
137 |
34 |
446 |
586 |
(24) |
||||
|
Research expenses |
|
94 |
98 |
(4) |
285 |
288 |
(1) |
||||