Oil & Gas
3rd Quarter 2016
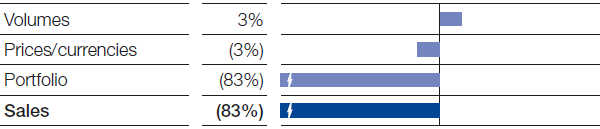
Sales in the Oil & Gas segment were considerably lower compared with the third quarter of 2015. As a result of the asset swap completed with Gazprom at the end of September 2015, the segment has no longer received contributions from the natural gas trading and storage business since the fourth quarter of 2015. This had contributed €2.9 billion to sales in the third quarter of 2015. In the continuing oil and gas business, we raised production by 13% year-on-year, whereas price and currency effects were minus 15%. The price of a barrel of Brent blend crude oil in the third quarter of 2016 was $46 on average (third quarter of 2015: $50 per barrel). Gas prices on European spot markets also fell sharply compared with the previous third quarter. We were able to ramp up our production, primarily in Russia and Norway.
Factors influencing sales, Oil & Gas
3rd Quarter 2016
Income from operations before special items declined considerably, as well. This was mainly attributable to the lower price levels, along with the divestiture of our gas trading and storage business to Gazprom. An additional factor was the reduced earnings contribution from our share in the Yuzhno Russkoye natural gas field. Net income fell considerably.
|
|
|
3rd Quarter |
January – September | ||||||||
|---|---|---|---|---|---|---|---|---|---|---|---|
|
|
|
2016 |
2015 |
Change % |
2016 |
2015 |
Change % | ||||
|
|||||||||||
|
Sales to third parties |
|
618 |
3,606 |
(83) |
1,846 |
12,267 |
(85) |
||||
|
Income from operations before depreciation and amortization (EBITDA) |
|
437 |
917 |
(52) |
1,101 |
2,243 |
(51) |
||||
|
Amortization, depreciation and impairments1 |
|
259 |
274 |
(5) |
764 |
734 |
4 |
||||
|
Income from operations (EBIT) |
|
178 |
643 |
(72) |
337 |
1,509 |
(78) |
||||
|
Special items |
|
(16) |
272 |
. |
(17) |
270 |
. |
||||
|
Income from operations (EBIT) before special items |
|
194 |
371 |
(48) |
354 |
1,239 |
(71) |
||||
|
Assets (September 30) |
|
12,447 |
12,806 |
(3) |
12,447 |
12,806 |
(3) |
||||
|
Investments2 |
|
270 |
445 |
(39) |
820 |
1,346 |
(39) |
||||
|
Research expenses |
|
9 |
12 |
(25) |
28 |
37 |
(24) |
||||
|
Exploration expenses |
|
18 |
32 |
(44) |
78 |
112 |
(30) |
||||
|
Net income |
|
33 |
625 |
(95) |
180 |
1,234 |
(85) |
||||