Agricultural Solutions
2nd Quarter 2016
- Sales considerably below prior second-quarter level owing to volumes and currency development
- Decrease in earnings due to lower sales volumes
In a market environment that remains difficult, especially in South America, we posted a considerable year-on-year sales decline in the Agricultural Solutions segment. Lower volumes and negative currency effects were the key factors for this development. We were able to slightly raise prices (volumes –8%, prices 1%, currencies –6%).
Sales
Change compared with 1st half 2015
−13%
EBIT before special items
(Change compared with 1st half 2015)
Million €
320 (−45)
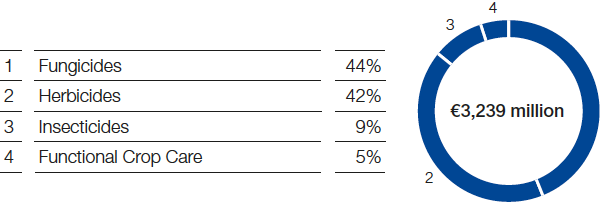
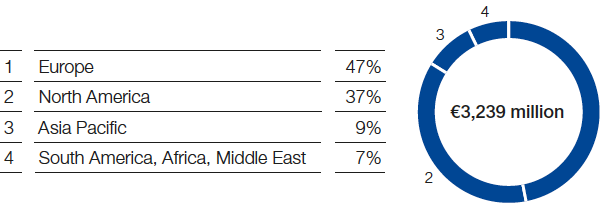
Sales declined considerably in Europe, mainly as a result of lower sales volumes. This was particularly true of fungicides in Germany and Poland, where demand was dampened by high customer inventory levels and by the cool, wet weather in broad parts of the region.
In North America, sales were slightly below the level of the prior second quarter owing to negative currency effects and lower prices. We were able to raise volumes slightly, thanks primarily to increased demand for the fungicides Xemium® and F500® in Canada and the United States.
Sales in Asia were slightly reduced by negative currency effects, which could not be offset by considerable volumes growth, especially of fungicides in China.
Lower volumes in the insecticides and fungicides businesses were primarily responsible for the considerable sales decline in South America. These in turn were largely attributable to high inventory levels and the still critical situation of many customers, especially in Brazil. We were only partly able to offset negative currency effects with price increases.
Compared with the second quarter of 2015, income from operations before special items fell considerably in the Agricultural Solutions segment, mainly on account of the lower sales volumes.
1st Half 2016 – Sales by indication and business
1st Half 2016 – Sales by region (location of customer)
|
|
2nd Quarter |
1st Half |
||||||
|---|---|---|---|---|---|---|---|---|---|
|
|
2016 |
2015 |
Change % |
2016 |
2015 |
Change % |
||
|
|||||||||
Sales to third parties |
|
1,459 |
1,678 |
(13) |
3,239 |
3,576 |
(9) |
||
Income from operations before depreciation and amortization (EBITDA) |
|
373 |
422 |
(12) |
1,018 |
1,048 |
(3) |
||
Amortization, depreciation and impairments |
|
85 |
57 |
49 |
140 |
110 |
27 |
||
Income from operations (EBIT) before special items |
|
320 |
365 |
(12) |
911 |
939 |
(3) |
||
Special items |
|
(32) |
− |
− |
(33) |
(1) |
. |
||
Income from operations (EBIT) |
|
288 |
365 |
(21) |
878 |
938 |
(6) |
||
Assets (June 30) |
|
8,749 |
8,514 |
3 |
8,749 |
8,514 |
3 |
||
Research expenses |
|
116 |
132 |
(12) |
230 |
258 |
(11) |
||
Investments1 |
|
74 |
106 |
(30) |
151 |
191 |
(21) |
||