Chart Gallery
-
Long-term performance of BASF shares compared with indexes Average annual increase with dividends reinvested
Go to corresponding page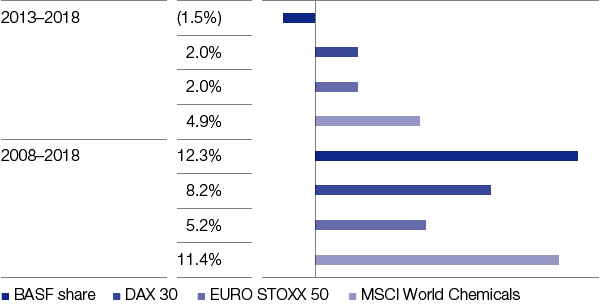
-
Dividend per share € per share
Go to corresponding page
-
Shareholder structure By region, rounded
Go to corresponding page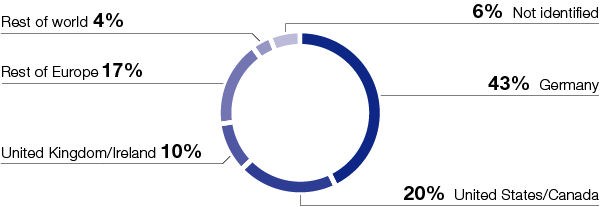
-
BASF sales by region 2018 Location of customer
Go to corresponding page
-
Sales2 in emerging markets
2 Percentage of BASF Group sales by location of customer Go to corresponding page
-
Research and development expenses by segment 2018
Go to corresponding page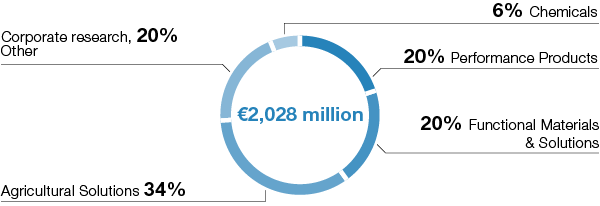
-
BASF Group donations, sponsorship and own projects in 20181
1 Figure relates to all consolidated companies with employees including joint operations, but excluding the vegetable seeds business acquired from Bayer (Nunhems®) Go to corresponding page
-
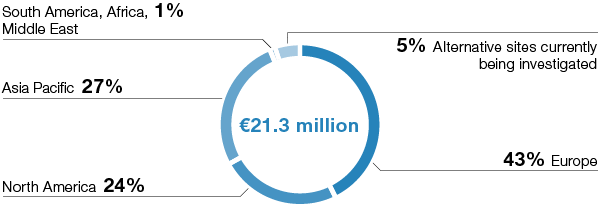
Additions to property, plant and equipment2 by segment in 2018
2 Including capitalized exploration, restoration obligations and IT investments
3 Including investments in connection with our oil and gas activities until September 2018 Go to corresponding page -
Additions to property, plant and equipment2 by region in 2018
2 Including capitalized exploration, restoration obligations and IT investments
3 Including investments in connection with our oil and gas activities until September 2018 Go to corresponding page -
Gross domestic product Real change compared with previous year
Go to corresponding page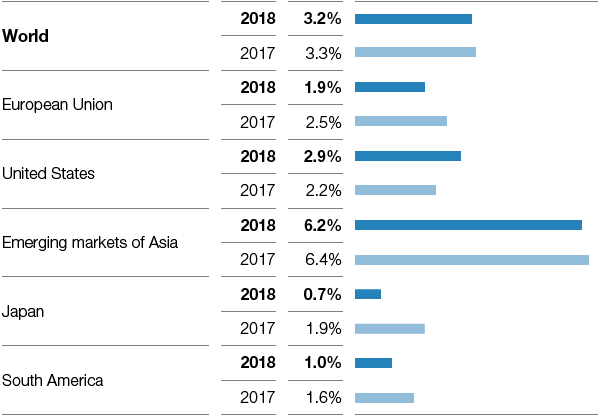
-
Growth in key customer industries Real change compared with previous year
Go to corresponding page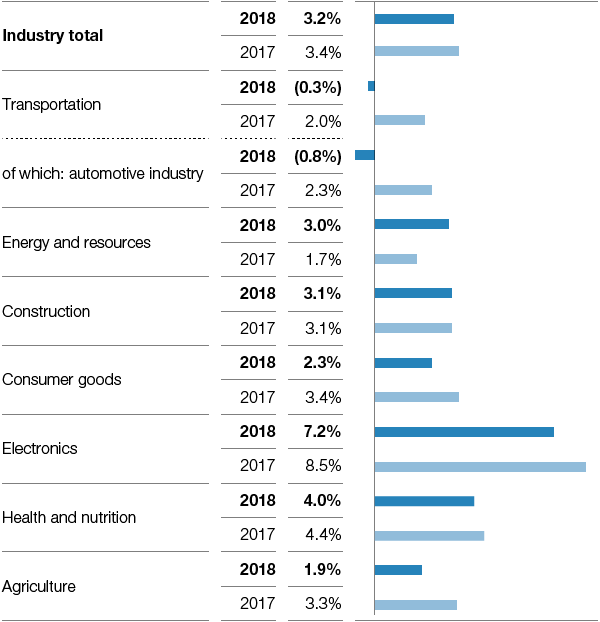
-
Chemical production (excluding pharmaceuticals) Real change compared with previous year
Go to corresponding page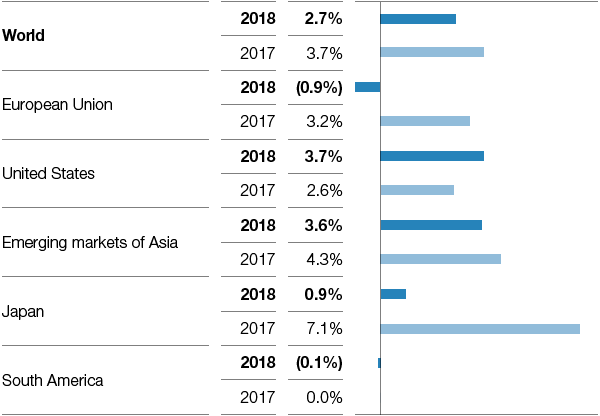
-
Sales2 Million €
2 Sales for 2017 were reduced by the share attributable to oil and gas activities due to their presentation as discontinued operations. Figures for the years 2014 to 2016 have not been restated. Go to corresponding page
-
EBIT before special items1 Million €
1 EBIT before special items for 2017 was reduced by the share attributable to oil and gas activities due to their presentation as discontinued operations. Figures for the years 2014 to 2016 have not been restated. Go to corresponding page
-
EBIT2 Million €
2 EBIT for 2017 was reduced by the share attributable to oil and gas activities due to their presentation as discontinued operations. Figures for the years 2014 to 2016 have not been restated. Go to corresponding page
-
EBIT after cost of capital3 Million €
3 EBIT after cost of capital for 2017 was reduced by the share attributable to oil and gas activities due to their presentation as discontinued operations. Figures for the years 2014 to 2016 have not been restated. Go to corresponding page
-
Maturities of financial indebtedness Million €
Go to corresponding page
-
Financing instruments Million €
Go to corresponding page
-
Cash flow Billion €
2 Including investments to the extent that they already had an effect on cash Go to corresponding page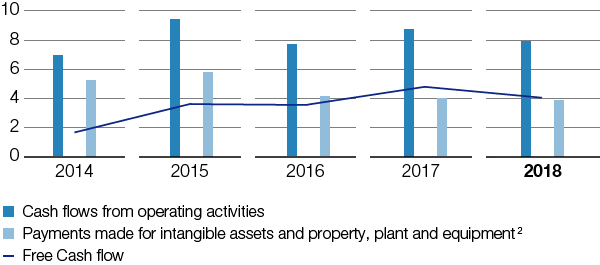
-
Contributions to total sales by segment
Go to corresponding page
-
Contributions to EBITDA by segment
Go to corresponding page
-
Contributions to EBIT before special items by segment
Go to corresponding page
-
Contributions to EBIT by segment
Go to corresponding page
-
Factors influencing sales
Go to corresponding page
-
Income from operations before special items Million €
Go to corresponding page
-
Petrochemicals – Factors influencing sales
Go to corresponding page
-
Petrochemicals – Sales by region Location of customer
Go to corresponding page
-
Monomers – Factors influencing sales
Go to corresponding page
-
Monomers – Sales by region Location of customer
Go to corresponding page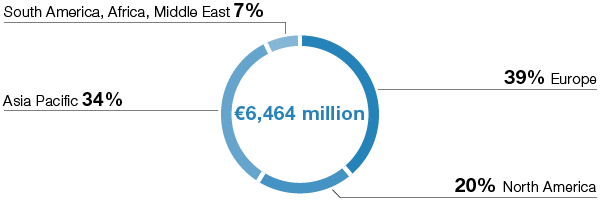
-
Intermediates – Factors influencing sales
Go to corresponding page
-
Intermediates – Sales by region Location of customer
Go to corresponding page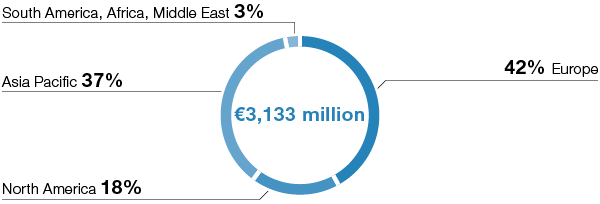
-
Factors influencing sales
Go to corresponding page
-
Income from operations before special items Million €
Go to corresponding page
-
Dispersions & Pigments – Factors influencing sales
Go to corresponding page
-
Dispersions & Pigments – Sales by region Location of customer
Go to corresponding page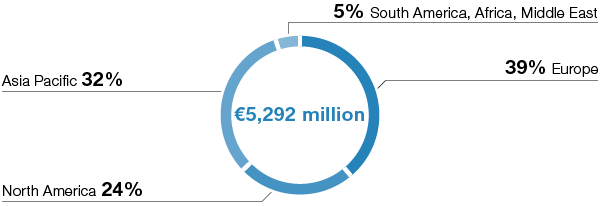
-
Care Chemicals – Factors influencing sales
Go to corresponding page
-
Care Chemicals – Sales by region Location of customer
Go to corresponding page
-
Nutrition & Health – Factors influencing sales
Go to corresponding page
-
Nutrition & Health – Sales by region Location of customer
Go to corresponding page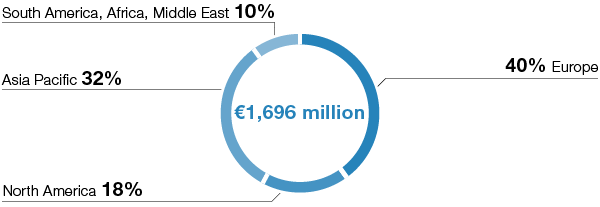
-
Performance Chemicals – Factors influencing sales
Go to corresponding page
-
Performance Chemicals – Sales by region Location of customer
Go to corresponding page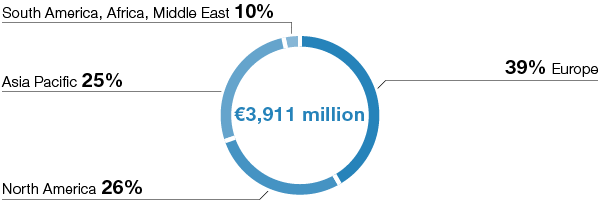
-
Factors influencing sales
Go to corresponding page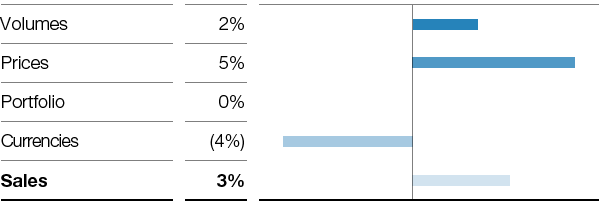
-
Income from operations before special items Million €
Go to corresponding page
-
Catalysts – Factors influencing sales
Go to corresponding page
-
Catalysts – Sales by region Location of customer
Go to corresponding page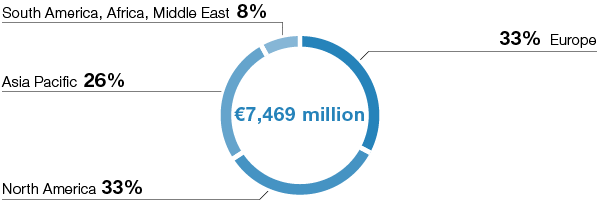
-
Construction Chemicals – Factors influencing sales
Go to corresponding page
-
Construction Chemicals – Sales by region Location of customer
Go to corresponding page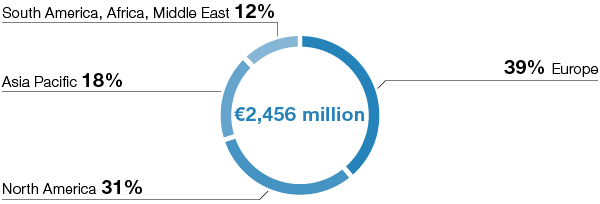
-
Coatings – Factors influencing sales
Go to corresponding page
-
Coatings – Sales by region Location of customer
Go to corresponding page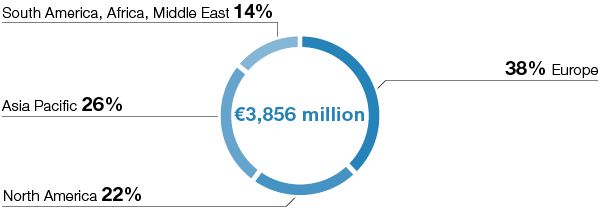
-
Performance Materials – Factors influencing sales
Go to corresponding page
-
Performance Materials – Sales by region Location of customer
Go to corresponding page
-
Factors influencing sales
Go to corresponding page
-
Income from operations before special items Million €
Go to corresponding page
-
Agricultural Solutions – Factors influencing sales
Go to corresponding page
-
Agricultural Solutions – Sales by region Location of customer
Go to corresponding page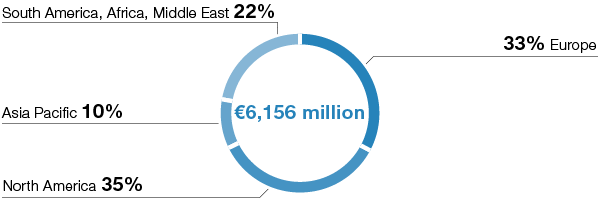
-
Sales by region Location of company
Go to corresponding page
-
Income from operations by region Location of company
Go to corresponding page
-
Reduction of greenhouse gas emissions per metric ton of sales product in BASF operations excluding the discontinued oil and gas business %
Go to corresponding page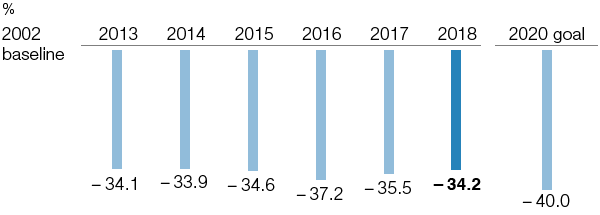
-
Certified energy management systems (ISO 50001) at BASF Group sites worldwide, in terms of primary energy demand
Go to corresponding page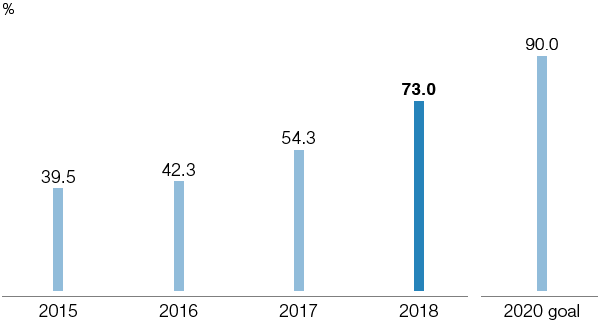
-
Greenhouse gas emissions along the BASF value chain in 20184 Million metric tons of CO2 equivalents
4 BASF operations including the discontinued oil and gas business; according to Greenhouse Gas Protocol, Scope 1, 2 and 3; categories within Scope 3 are shown in parentheses Go to corresponding page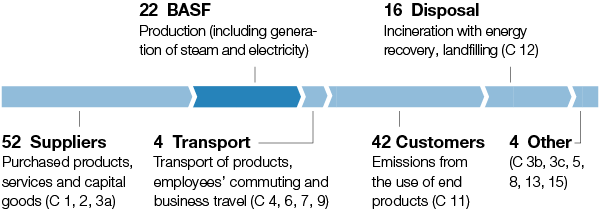
-
Prevention of greenhouse gas emissions through the use of BASF products Million metric tons of CO2 equivalents
Go to corresponding page
-
BASF Group employee age structure (Total: 122,404, of which 25.1% women, as of December 31, 2018)
Go to corresponding page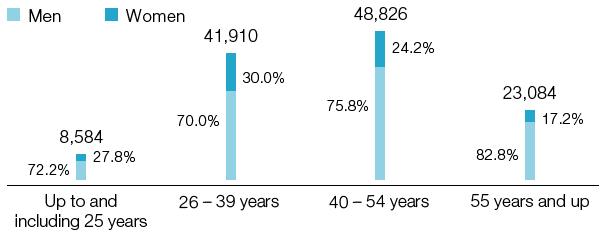
-
Outlook for gross domestic product 2019 Real change compared with previous year
Go to corresponding page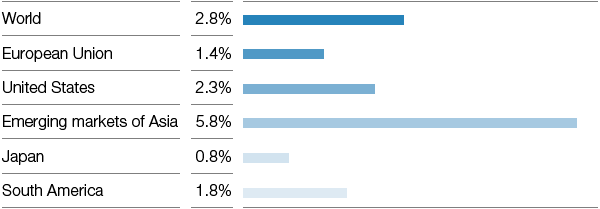
-
Trends in gross domestic product 2019–2021 Average annual real change
Go to corresponding page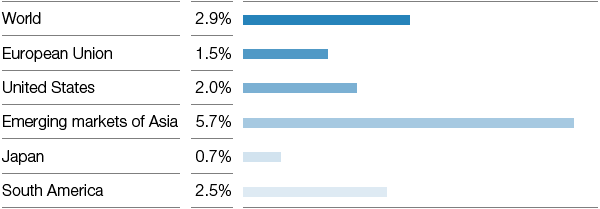
-
Outlook for chemical production 2019 (excluding pharmaceuticals) Real change compared with previous year
Go to corresponding page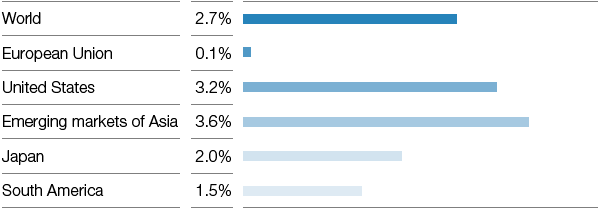
-
Trends in chemical production 2019–2021 (excluding pharmaceuticals) Real change compared with previous year
Go to corresponding page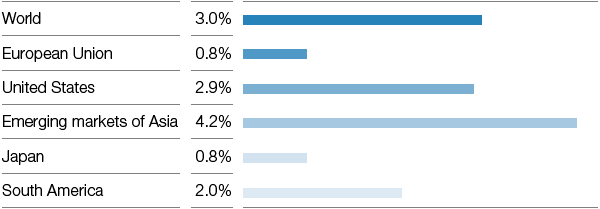
-
Capex by segment 2019–2023
Go to corresponding page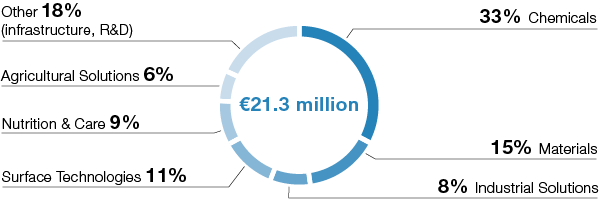
-
Capex by region 2019–2023
Go to corresponding page