Trends in key customer industries
- Global industrial production increases at rate similar to 2015
- Development in key customer industries improves on average
Global industrial production grew by around 1.9% in 2016, about the same as in the previous year (+2.0%). Growth in the advanced economies slowed slightly (2016: +0.8%, 2015: +1.0%) but remained constant in the emerging markets (2016: +3.0%, 2015: +3.0%).
Industrial growth in the European Union increased marginally to 1.4% from 1.3%. In the United States, industrial production nearly stagnated (2016: +0.3%; 2015: +1.3%). At 5.5%, industrial growth in the emerging markets of Asia roughly matched the prior year’s level. Industry in China cooled down only slightly, thanks to governmental stimulus. The recession continued in South America: Industrial production shrank in Brazil by 6.0% (2015: –8.2%).
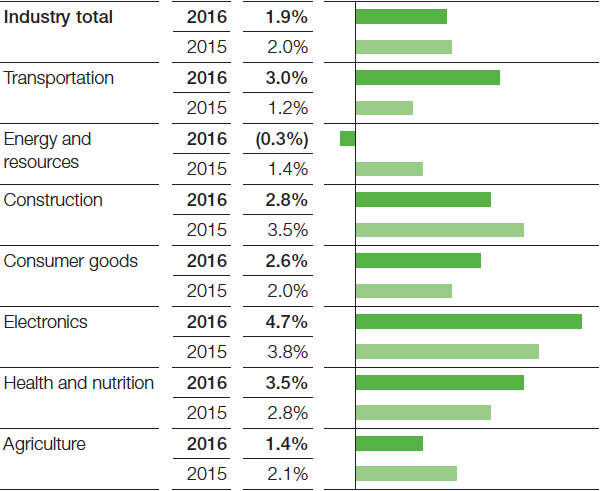
The chemical industry’s key customer sectors developed better on average than industrial production. Global automotive production grew by 4.5%, outpacing the previous year. In western Europe and North America, the sector continued its economic upswing. Tax incentives in China boosted demand; however, production fell drastically in South America and Russia. The global rate of growth in the construction industry was 2.8%, down from the previous year’s +3.5%. In western Europe, construction saw slightly higher growth than in 2015; in the eastern countries of the European Union, the expiration of E.U. funding programs led to decreased activity. Growth in the United States slowed considerably. In China, construction volumes rose at around the same rate as 2015 as a result of governmental support measures. Globally, agriculture grew by 1.4%, behind the level in previous years; production weakened in South America especially.
Growth in key customer industries
(Real change compared with previous year1)

1 Figures that refer to previous years may deviate from last year’s report due to statistical revisions.
BASF sales by industry2 |
||||
|
||||
>20% |
|
Chemicals and plastics |
||
|---|---|---|---|---|
10–20% |
|
Consumer goods | Transportation |
||
5–10% |
|
Agriculture | Construction | Energy and resources |
||
<5% |
|
Health and nutrition | Electronics |
||