BASF Group 2016 at a glance
Economic data
|
|
|
2016 |
2015 |
Change in % |
||||
|---|---|---|---|---|---|---|---|---|---|
|
|||||||||
Sales |
|
million € |
57,550 |
70,449 |
(18.3) |
||||
Income from operations before depreciation and amortization (EBITDA) and special items |
|
million € |
10,327 |
10,508 |
(1.7) |
||||
EBITDA |
|
million € |
10,526 |
10,649 |
(1.2) |
||||
Amortization and depreciation1 |
|
million € |
4,251 |
4,401 |
(3.4) |
||||
Income from operations (EBIT) |
|
million € |
6,275 |
6,248 |
0.4 |
||||
Special items |
|
million € |
(34) |
(491) |
93.1 |
||||
EBIT before special items |
|
million € |
6,309 |
6,739 |
(6.4) |
||||
Financial result |
|
million € |
(880) |
(700) |
(25.7) |
||||
Income before taxes and minority interests |
|
million € |
5,395 |
5,548 |
(2.8) |
||||
Net income |
|
million € |
4,056 |
3,987 |
1.7 |
||||
EBIT after cost of capital |
|
million € |
1,136 |
194 |
485.6 |
||||
Earnings per share |
|
€ |
4.42 |
4.34 |
1.8 |
||||
Adjusted earnings per share |
|
€ |
4.83 |
5.00 |
(3.4) |
||||
Dividend per share |
|
€ |
3.00 |
2.90 |
3.4 |
||||
|
|
|
|
|
|
||||
Research and development expenses |
|
million € |
1,863 |
1,953 |
(4.6) |
||||
Personnel expenses |
|
million € |
10,165 |
9,982 |
1.8 |
||||
Number of employees |
|
|
113,830 |
112,435 |
1.2 |
||||
|
|
|
|
|
|
||||
Assets |
|
million € |
76,496 |
70,836 |
8.0 |
||||
Investments2 |
|
million € |
7,258 |
6,013 |
20.7 |
||||
|
|
|
|
|
|
||||
Equity ratio |
|
% |
42.6 |
44.5 |
– |
||||
Return on assets |
|
% |
8.2 |
8.7 |
– |
||||
Return on equity after tax |
|
% |
13.3 |
14.4 |
– |
||||
Net debt |
|
million € |
14,401 |
12,935 |
11.3 |
||||
Cash provided by operating activities |
|
million € |
7,717 |
9,446 |
(18.3) |
||||
Free cash flow |
|
million € |
3,572 |
3,634 |
(1.7) |
||||
Value added
Value added 20163
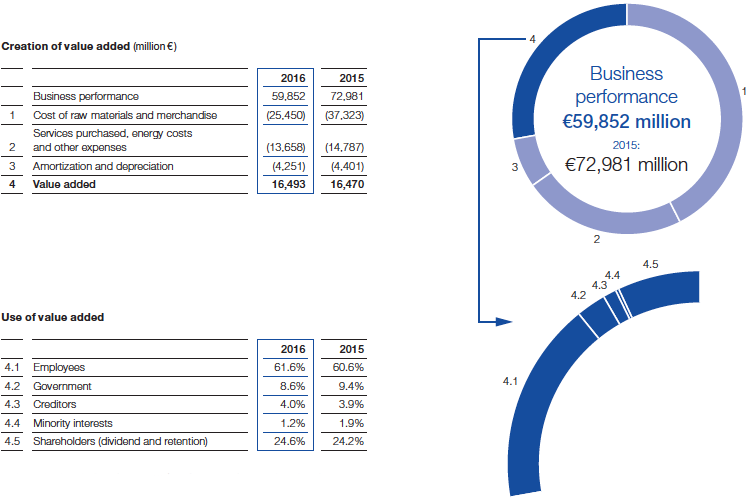
3 Value added results from the company’s performance minus goods and services purchased, depreciation and amortization. Business performance includes sales revenues, other operating income, interest income and net income from shareholdings. Value added shows the BASF Group’s contribution to both private and public income as well as its distribution among all stakeholders.
Innovation
|
|
|
2016 |
2015 |
Change in % |
|---|---|---|---|---|---|
Research and development expenses |
|
million € |
1,863 |
1,953 |
(4.6) |
Number of employees in research and development at year-end |
|
|
9,966 |
10,010 |
(0.4) |
Employees and society
|
|
|
2016 |
2015 |
Change in % |
|---|---|---|---|---|---|
Employees |
|
|
|
|
|
Employees at year-end |
|
|
113,830 |
112,435 |
1.2 |
Apprentices at year-end |
|
|
3,120 |
3,240 |
(3.7) |
Personnel expenses |
|
million € |
10,165 |
9,982 |
1.8 |
Society |
|
|
|
|
|
Donations and sponsorship |
|
million € |
47.0 |
56.2 |
(16.4) |
Environment, health, safety and security
|
|
|
2016 |
2015 |
Change in % |
||||||
|---|---|---|---|---|---|---|---|---|---|---|---|
|
|||||||||||
Safety, security and health |
|
|
|
|
|
||||||
Transportation incidents with significant impact on the environment |
|
|
0 |
0 |
0 |
||||||
Process safety incidents |
|
per one million working hours |
2.0 |
2.1 |
(4.8) |
||||||
Lost-time injuries |
|
per one million working hours |
1.4 |
1.4 |
0 |
||||||
Health Performance Index4 |
|
|
0.96 |
0.97 |
(1.0) |
||||||
Environment |
|
|
|
|
|
||||||
Primary energy use5 |
|
million MWh |
57.4 |
57.3 |
0.2 |
||||||
Energy efficiency in production processes |
|
kilograms of sales product/MWh |
617 |
599 |
3.0 |
||||||
Total water withdrawal |
|
million cubic meters |
1,649 |
1,686 |
(2.2) |
||||||
Withdrawal of drinking water |
|
million cubic meters |
20.7 |
22.1 |
(6.3) |
||||||
Emissions of organic substances to water6 |
|
thousand metric tons |
15.9 |
17.3 |
(8.1) |
||||||
Emissions of nitrogen to water6 |
|
thousand metric tons |
2.9 |
3.0 |
(3.3) |
||||||
Emissions of heavy metals to water6 |
|
metric tons |
23.2 |
25.1 |
(7.6) |
||||||
Emissions of greenhouse gases |
|
million metric tons of CO2 equivalents |
21.9 |
22.2 |
(1.4) |
||||||
Emissions to air (air pollutants)6 |
|
thousand metric tons |
26.7 |
28.6 |
(6.6) |
||||||
Waste |
|
million metric tons |
2.1 |
2.0 |
5.0 |
||||||
Operating costs for environmental protection |
|
million € |
1,011 |
962 |
5.1 |
||||||
Investments in environmental protection plants and facilities |
|
million € |
206 |
346 |
(40.5) |
||||||
Audits along the value chain
|
|
2016 |
2015 |
Change in % |
|---|---|---|---|---|
Suppliers |
|
|
|
|
Number of on-site sustainability audits of raw material suppliers |
|
104 |
135 |
(23.0) |
Responsible Care Management System |
|
|
|
|
Number of environmental and safety audits |
|
121 |
130 |
(6.9) |
Number of short-notice audits |
|
37 |
68 |
(45.6) |
Number of occupational medicine and health protection audits |
|
30 |
53 |
(43.4) |