Income from operations
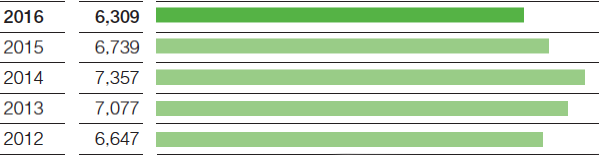
- EBIT before special items 6% below 2015 level, at €6,309 million
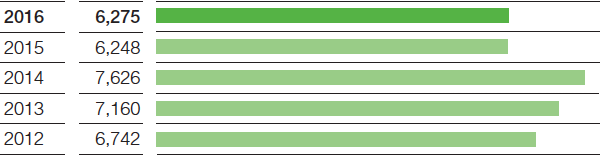
- At €6,275 million, EBIT matches prior-year level
- EBIT after cost of capital rises considerably
At €6,309 million, income from operations (EBIT) before special items was €430 million below the level of the previous year. This was largely a consequence of the considerable decline in the Oil & Gas segment resulting mainly from falling prices and the divestiture of the natural gas trading and storage business. The activities transferred to Gazprom had contributed around €260 million to EBIT before special items in 2015. In the Agricultural Solutions segment, EBIT before special items matched the previous year’s level. We achieved a considerable increase in the chemicals business thanks to sharply improved contributions from the Performance Products and Functional Materials & Solutions segments.
EBIT before special items (million €)
Special items in EBIT amounted to minus €34 million in 2016, compared with minus €491 million in the previous year.
This development was mainly due to the special items recognized in other charges and income, which amounted to minus €44 million in 2016. In the previous year, other charges and income totaled minus €729 million, mostly comprising impairments on assets in the Oil & Gas segment.
Special charges from various restructuring measures came out to minus €394 million compared with minus €223 million in the previous year.
Divestitures in 2016 resulted in an earnings contribution of €431 million, after €476 million in the previous year, especially from the sale of the industrial coatings business and the polyolefin catalysts business in the Functional Materials & Solutions segment.
Integration costs for acquired businesses amounted to €27 million, compared with €15 million in 2015.
Special items (million €) |
|||
|
|
2016 |
2015 |
|---|---|---|---|
Restructuring measures |
|
(394) |
(223) |
Integration costs |
|
(27) |
(15) |
Divestitures |
|
431 |
476 |
Other charges and income |
|
(44) |
(729) |
Total special items in EBIT |
|
(34) |
(491) |
Special items reported in financial result |
|
– |
23 |
Total special items in income before taxes and minority interests |
|
(34) |
(468) |
At €6,275 million, EBIT for the BASF Group in 2016 matched the level of the previous year (2015: €6,248 million). Included in this figure is income from companies accounted for using the equity method, which rose from €251 million to €307 million.
EBIT (million €)
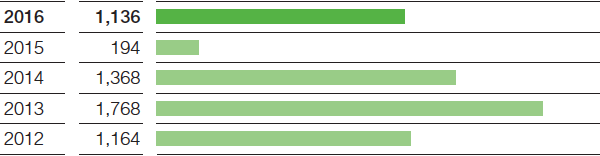
We once again earned a premium on our cost of capital in 2016. EBIT after cost of capital amounted to €1,136 million compared with €194 million in the previous year. The cost of capital fell by €809 million year-on-year. In addition to the reduction of the cost of capital percentage by one percentage point, this was primarily the result of the lower level of tied-up capital in inventories and operating receivables.
The calculation of EBIT as part of our income statement is shown in the Consolidated Financial Statements
EBIT after cost of capital (million €) |
|||||
|
|
2016 |
2015 |
||
|---|---|---|---|---|---|
|
|||||
EBIT of BASF Group |
|
6,275 |
6,248 |
||
– EBIT of Other |
|
(1,091) |
(985) |
||
– Cost of capital1 |
|
6,230 |
7,039 |
||
EBIT after cost of capital |
|
1,136 |
194 |
||
EBIT after cost of capital (million €)