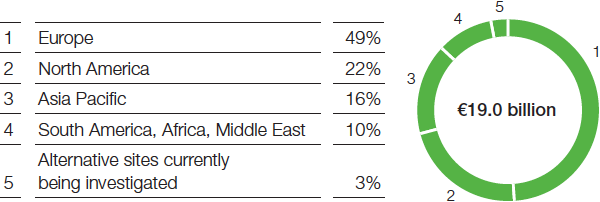
Chart Gallery
-
Long-term performance of BASF shares compared with indexes (Average annual increase with dividends reinvested)
Go to corresponding page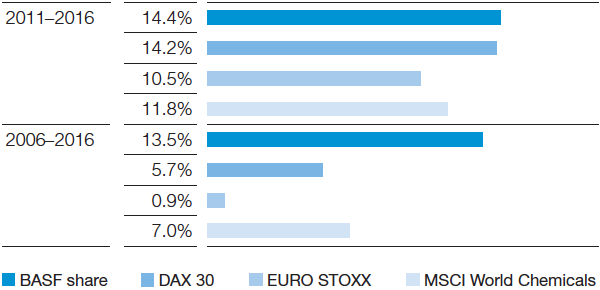
-
Dividend per share1 (€ per share)
1 Adjusted for two-for-one stock split conducted in 2008 Go to corresponding page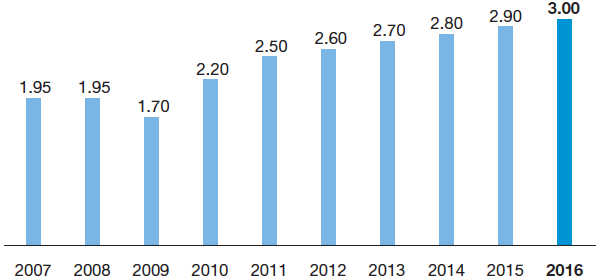
-
Shareholder structure (by region)
Go to corresponding page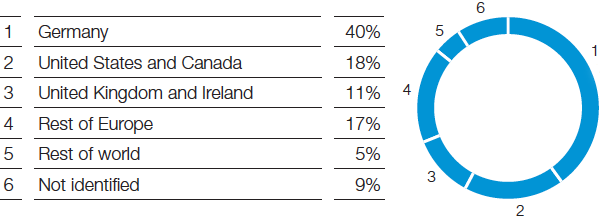
-
Sales2 in emerging markets
2 Percentage of BASF Group sales (excluding Oil & Gas) by location of customer
3 Comprises EU15, Norway, Switzerland, United States, Canada, Japan, South Korea, Australia, New Zealand Go to corresponding page -
Chemicals
Go to corresponding page
-
Additions to property, plant and equipment4 by segment in 2016
Go to corresponding page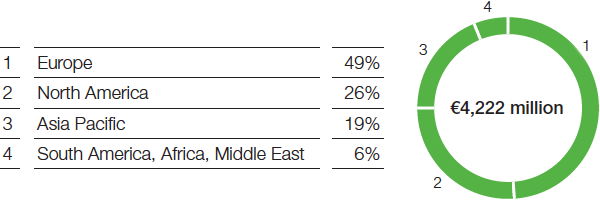
-
Additions to property, plant and equipment4 by region in 2016
Go to corresponding page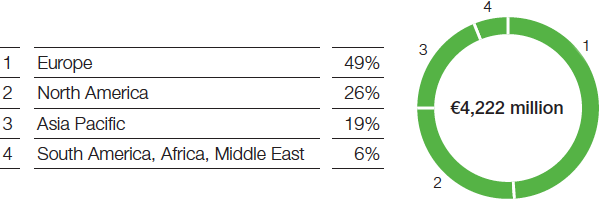
-
BASF Group employee age structure (Total: 113,830, thereof 24.6% women, as of December 31, 2016)
Go to corresponding page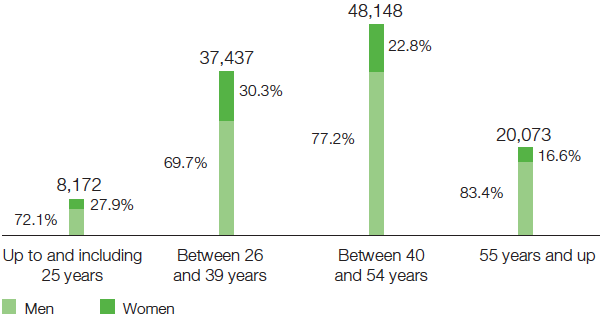
-
Balancing personal and professional life (Total BASF SE employees: 35,001, thereof 21.4% women, as of December 31, 2016)
Go to corresponding page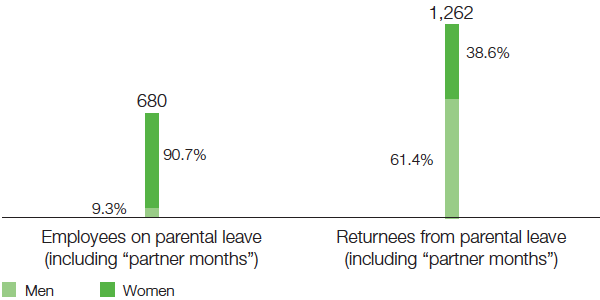
-
BASF Group donations, sponsorship and own projects in 2016 (million €)
Go to corresponding page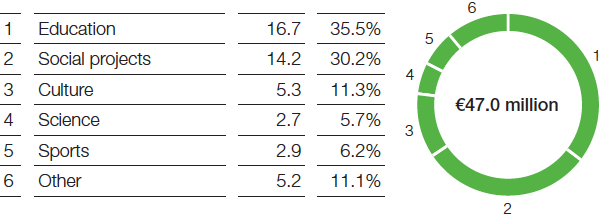
-
Gross domestic product (Real change compared with previous year1)
1 Figures that refer to previous years may deviate from last year’s report due to statistical revisions. Go to corresponding page
-
Growth in key customer industries (Real change compared with previous year1)
1 Figures that refer to previous years may deviate from last year’s report due to statistical revisions. Go to corresponding page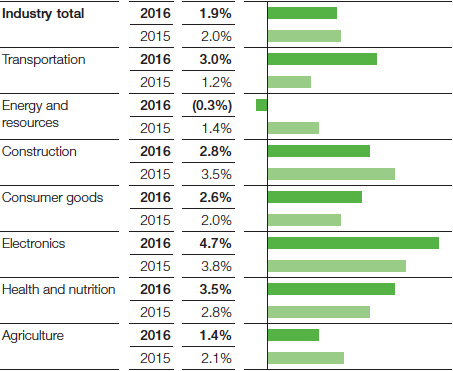
-
Chemical production (excluding pharmaceuticals) (Real change compared with previous year2)
2 Figures that refer to previous years may deviate from last year’s report due to statistical revisions. Go to corresponding page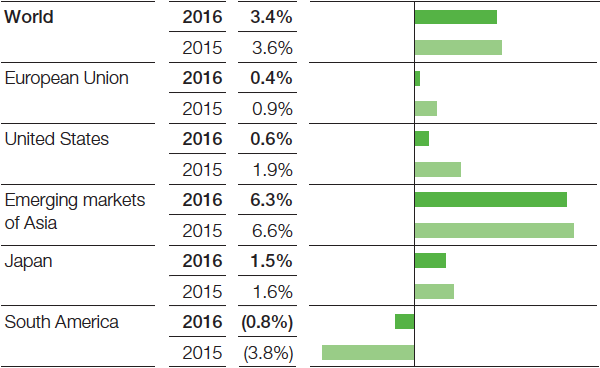
-
Sales (million €)
Go to corresponding page
-
EBIT before special items (million €)
Go to corresponding page
-
EBIT (million €)
Go to corresponding page
-
EBIT after cost of capital (million €)
Go to corresponding page
-
Maturities of financial indebtedness (million €)
Go to corresponding page
-
Financing instruments (million €)
Go to corresponding page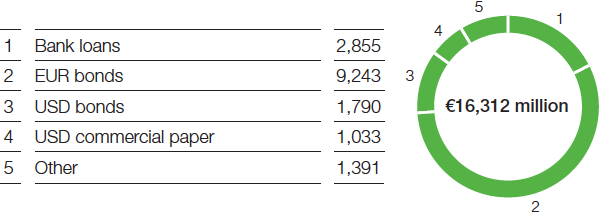
-
Cash flow (billion €)
1 Including investments to the extent that they already had an effect on cash. Go to corresponding page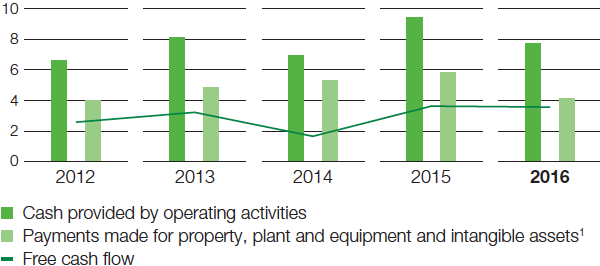
-
Contributions to total sales by segment
Go to corresponding page
-
Contributions to EBITDA by segment
Go to corresponding page
-
EBIT before special items by segment (million €)
Go to corresponding page
-
EBIT before special items BASF Group by quarter1 (million €)
1 Quarterly results not audited Go to corresponding page
-
Factors influencing sales
Go to corresponding page
-
Income from operations before special items (million €)
Go to corresponding page
-
Petrochemicals – Factors influencing sales
Go to corresponding page
-
Petrochemicals – Sales by region (Location of customer)
Go to corresponding page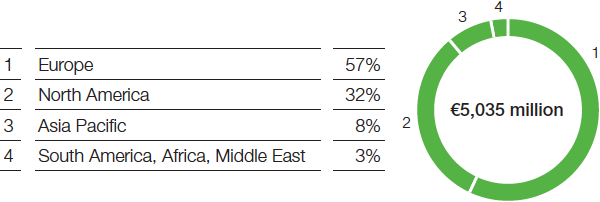
-
Monomers – Factors influencing sales
Go to corresponding page
-
Monomers – Sales by region (Location of customer)
Go to corresponding page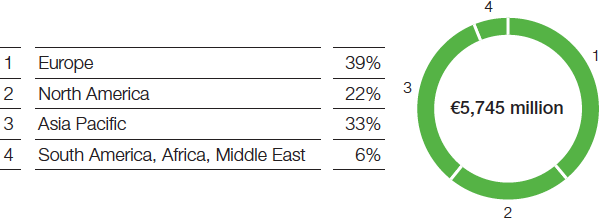
-
Intermediates – Factors influencing sales
Go to corresponding page
-
Intermediates – Sales by region (Location of customer)
Go to corresponding page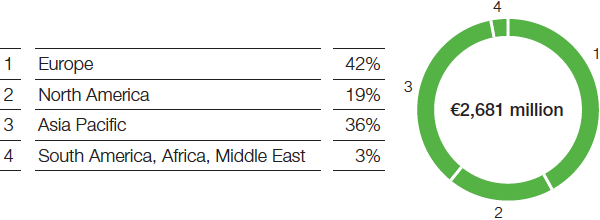
-
Factors influencing sales
Go to corresponding page
-
Income from operations before special items (million €)
Go to corresponding page
-
Dispersions & Pigments – Factors influencing sales
Go to corresponding page
-
Dispersions & Pigments – Sales by region (Location of customer)
Go to corresponding page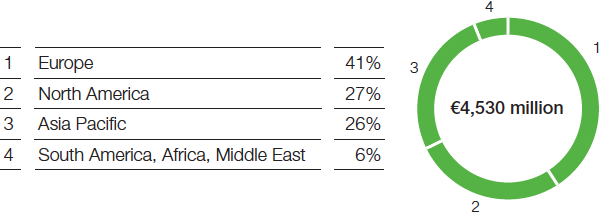
-
Care Chemicals – Factors influencing sales
Go to corresponding page
-
Care Chemicals – Sales by region (Location of customer)
Go to corresponding page
-
Nutrition & Health – Factors influencing sales
Go to corresponding page
-
Nutrition & Health – Sales by region (Location of customer)
Go to corresponding page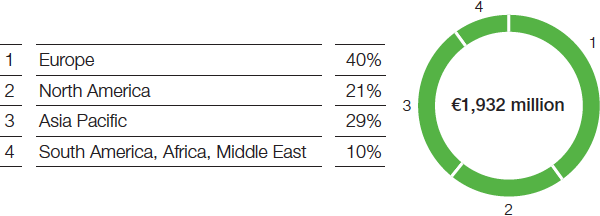
-
Performance Chemicals – Factors influencing sales
Go to corresponding page
-
Performance Chemicals – Sales by region (Location of customer)
Go to corresponding page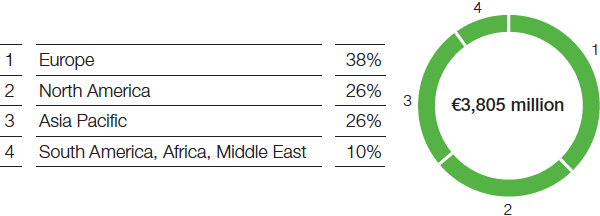
-
Factors influencing sales
Go to corresponding page
-
Income from operations before special items (million €)
Go to corresponding page
-
Catalysts – Factors influencing sales
Go to corresponding page
-
Catalysts – Sales by region (Location of customer)
Go to corresponding page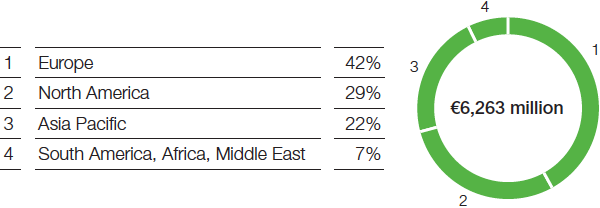
-
Construction Chemicals – Factors influencing sales
Go to corresponding page
-
Construction Chemicals – Sales by region (Location of customer)
Go to corresponding page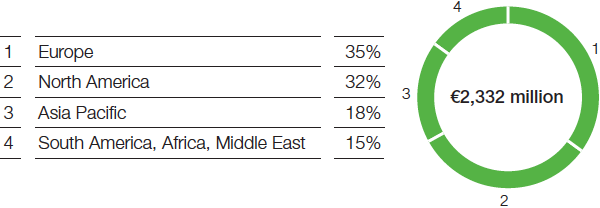
-
Coatings – Factors influencing sales
Go to corresponding page
-
Coatings – Sales by region (Location of customer)
Go to corresponding page
-
Performance Materials – Factors influencing sales
Go to corresponding page
-
Performance Materials – Sales by region (Location of customer)
Go to corresponding page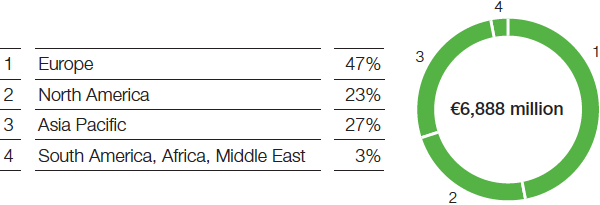
-
Factors influencing sales
Go to corresponding page
-
Income from operations before special items (million €)
Go to corresponding page
-
Crop Protection – Sales by region (Location of customer)
Go to corresponding page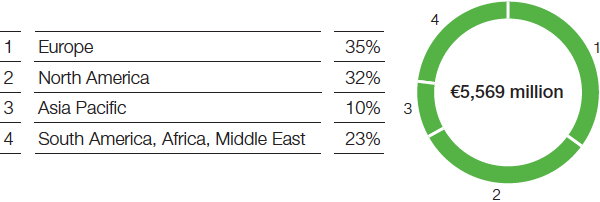
-
Factors influencing sales
Go to corresponding page
-
Income from operations before special items (million €)
Go to corresponding page
-
Oil & Gas – Sales by region (Location of customer)
Go to corresponding page
-
Sales by region (Location of company)
Go to corresponding page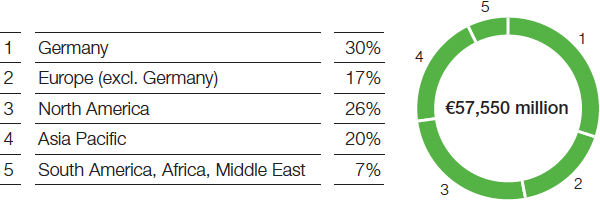
-
Income from operations by region (Location of company)
Go to corresponding page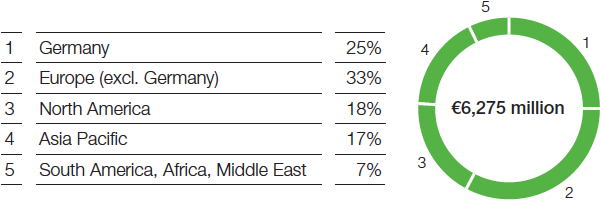
-
Lost-time injury rate per one million working hours
Go to corresponding page
-
Reduction of greenhouse gas emissions per metric ton of sales product in BASF operations excluding Oil & Gas1, 2 (%)
1 The figure for 2011 was not adjusted to reflect the scope of consolidation pursuant to International Financial Reporting Standards 10 and 11. For more information on our data collection methods, see data.
2 The figures for the 2011 and 2012 business years were not adjusted to the currently applied factors for global warming potential. For more information on our data collection methods, see this page. Go to corresponding page -
Certified energy management systems (ISO 50001) introduced at BASF Group sites worldwide, in terms of primary energy demand (%)
Go to corresponding page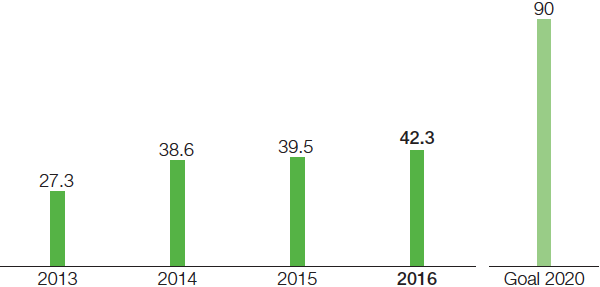
-
Greenhouse gas emissions along the BASF value chain in 20164 (million metric tons of CO2 equivalents)
4 According to Greenhouse Gas Protocol, Scope 1, 2 and 3; categories within Scope 3 are shown in parentheses Go to corresponding page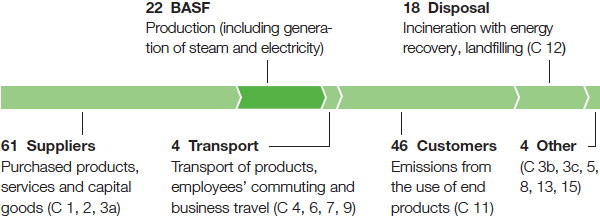
-
Prevention of greenhouse gas emissions through the use of BASF products (million metric tons of CO2 equivalents)
Go to corresponding page
-
Outlook for gross domestic product 2017 (Real change compared with previous year)
Go to corresponding page
-
Trends in gross domestic product 2017–2019 (Average annual real change)
Go to corresponding page
-
Outlook for chemical production 2017 (excl. pharmaceuticals) (Real change compared with previous year)
Go to corresponding page
-
Trends in chemical production 2017–2019 (excl. pharmaceuticals) (Average annual real change)
Go to corresponding page
-
Investments in property, plant and equipment by segment, 2017–2021
Go to corresponding page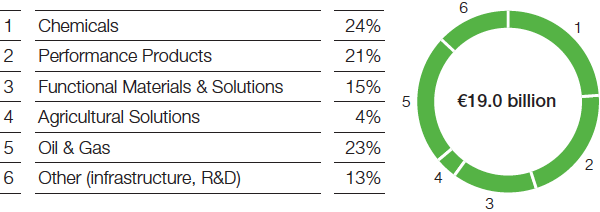
-
Investments in property, plant and equipment by region, 2017–2021
Go to corresponding page