BASF Group
At BASF, we create chemistry for a sustainable future. We combine economic success with environmental protection and social responsibility. Around 112,000 employees contribute to the BASF Group’s success worldwide. Our business comprises the Chemicals, Materials, Industrial Solutions, Surface Technologies, Nutrition & Care and Agricultural Solutions segments.
The BASF Group’s segments in 2023
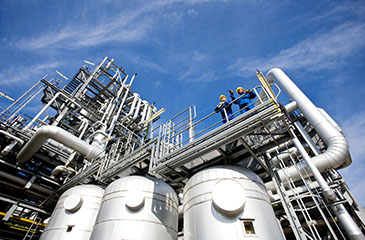
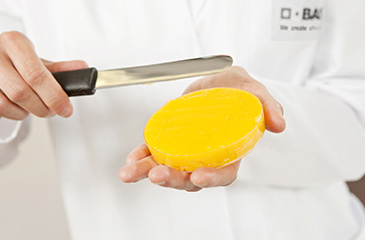
Chemicals
The Chemicals segment supplies BASF’s other segments and customers with basic chemicals and intermediates.
- Share of sales: 15.0%
- R&D expenses: €83 million
- Investments incl. acquisitions1: €2,706 million
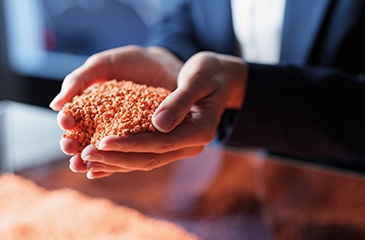
Materials
In the Materials segment, we produce advanced materials and their precursors for the plastics and plastics processing industries.
- Share of sales: 20.5%
- R&D expenses: €185 million
- Investments incl. acquisitions1: €1,083 million
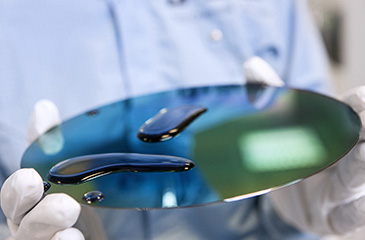
Industrial Solutions
The Industrial Solutions segment develops and markets ingredients and additives for industrial applications.
- Share of sales: 11.6%
- R&D expenses: €150 million
- Investments incl. acquisitions1: €285 million
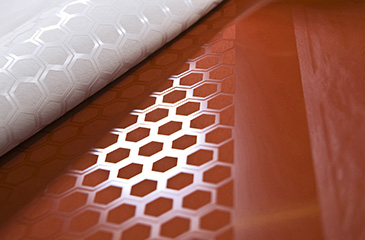
Surface Technologies
The Surface Technologies segment provides chemical solutions for surfaces and automotive OEM coatings, as well as battery materials and catalysts.
- Share of sales: 23.5%
- R&D expenses: €304 million
- Investments incl. acquisitions1: €621 million
Nutrition & Care
The Nutrition & Care segment produces ingredients and solutions for consumer applications such as human and animal nutrition, cleaning agents and personal care.
- Share of sales: 10.0%
- R&D expenses: €150 million
- Investments incl. acquisitions1: €765 million
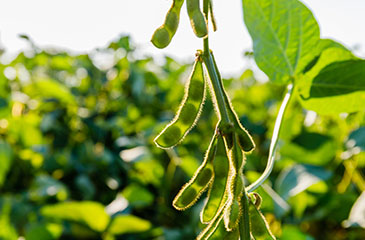
Agricultural Solutions
The Agricultural Solutions segment is an integrated solutions provider of seeds, crop protection products and digital solutions for the agricultural sector.
- Share of sales: 14.6%
- R&D expenses: €900 million
- Investments incl. acquisitions1: €353 million
1 Additions to property, plant and equipment and intangible assets